Internet section
It is possible to access the devices and data of an optiCLOUD server via the Internet area in the optiCONTROL software. Several server instances can be connected for convenient access to the measurement data.
As soon as the user switches to the Internet area, all saved bookmarks are loaded and displayed. are loaded and displayed.
Menu
The following functions are available in the main menu of the Internet area:
![]()
Description:
| Icon | Description |
|---|---|
| Add new bookmark | |
| Delete selected bookmark | |
| Edit selected bookmark | |
| Refresh complete bookmark list | |
| Refresh only the currently selected bookmark | |
| Collapse all bookmarks | |
| Unfold all bookmarks |
Add bookmark
Here you have the option to add and establish a new bookmark or connection to a server.

If you click on the "Add bookmark" button, an input mask opens in which you
enter the domain of the server under Bookmarks. If necessary, also enter the user and password in the corresponding fields.
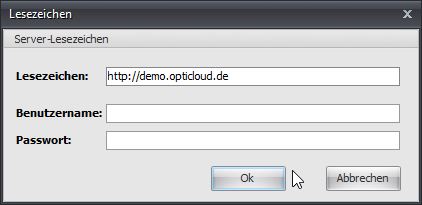
You will receive the exact connection data directly from optiMEAS.
If the server is the new version "optiCLOUD Dashboard", the role or tenant must be entered in addition to the
user name and password (same data as on the website), the role or tenant must also be entered.
must be entered. The roles available for the user are displayed in the drop-down menu
and can be selected. Normally, only one role is available for the user.

Bookmark information
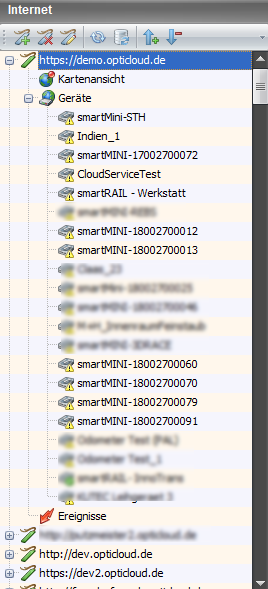
If you now open the bookmark entry, you can see which devices are connected to the server.
are connected to the server. If you select one of the devices in the list, an overview of the device appears.
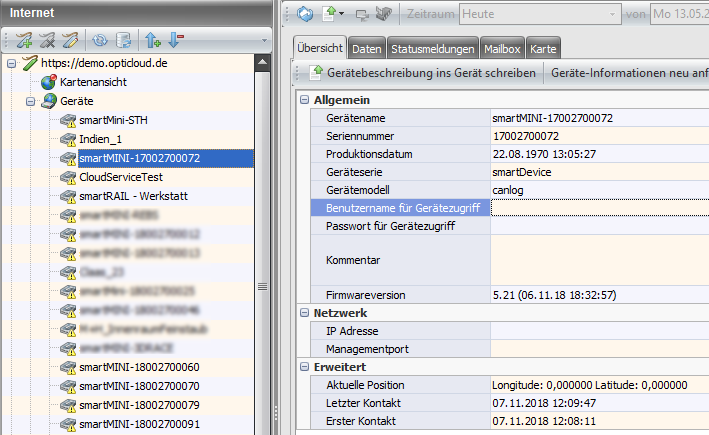
The information and functions for each registered system are then displayed on the right-hand side.
The following functions and areas are available:
| Function | Description |
|---|---|
| Overview | Displays the general device information, such as name, serial number, firmware version and the last known position and when the device last reported to the server. |
| Data | All files transferred by the device are displayed here. Furthermore, the measurement data can be downloaded from there to the local computer. |
| Status messages | Displays the status messages of the device. |
| Mailbox | Lists all messages that have been stored on the server for the device |
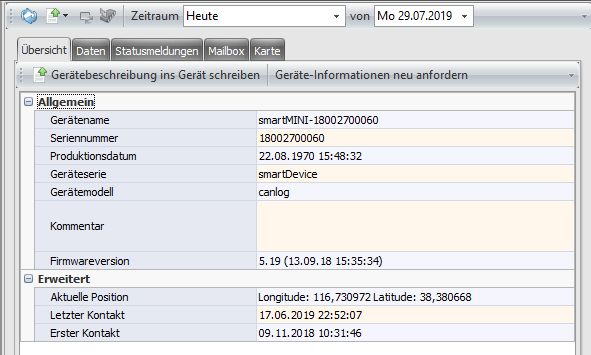
Device overview
General information about this device can be found under the "Overview" tab, which is
stored on the server. This includes information such as the device name, the serial
serial number, the current firmware version, the last contact time to the server and the last known position.
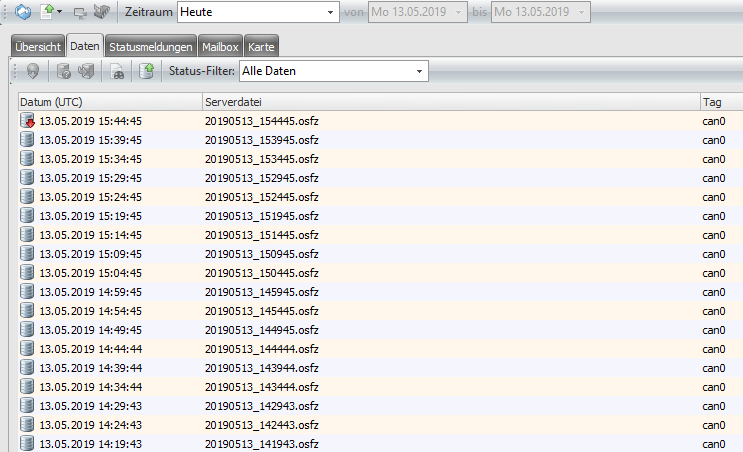
Data
The "Data" tab shows the data provided by this device. This display can be restricted via the period setting. Note the symbols next to the data:
| Symbol / Icon | Description |
|---|---|
| File available on server, can be downloaded. | |
| File available on server and already downloaded and available on computer. | |
| File reported by device to server but not yet uploaded to server. Can be requested directly from the device using the "Request data" function. | |
| File is currently being requested by the server and should be uploaded to the server by the device. |
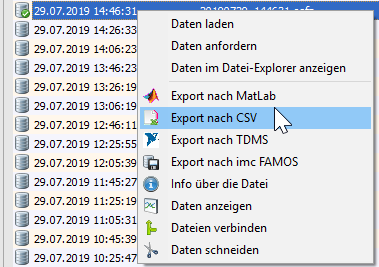
By right-clicking on any file, it can be requested or downloaded to the local computer.
computer.
Further functions are available both by right-clicking and on the right-hand side of optiCONTROL.
available. These include several options for exporting the data to other formats,
information about the file, to display the data in a graph, as well as to combine
several files or to cut a file, i.e. to save only part of the entire data set separately.
data set separately.
A file located on the server can be downloaded via the context menu.

As soon as a file has been loaded onto the local PC, it can be further processed via the context menu
for further processing. See File operations
Request data at a later date
Osf files that are marked as not yet uploaded to the server ![]() can be subsequently
or requested again from the device. This may be necessary if a device has been offline for a longer
time and was unable to upload the files to the server for a certain period of time or if the upload
the upload requests for individual files have timed out and were no longer taken into account by the device.
no longer taken into account by the device.
can be subsequently
or requested again from the device. This may be necessary if a device has been offline for a longer
time and was unable to upload the files to the server for a certain period of time or if the upload
the upload requests for individual files have timed out and were no longer taken into account by the device.
no longer taken into account by the device.
The ![]() button can be used to request new files from the device for a certain period of time.
be requested.
button can be used to request new files from the device for a certain period of time.
be requested.

The file tag must be specified in the dialog (normally "preview") and the exact time period.
time period.

As soon as the device has read this request, it searches the internal memory for all files files that were created during this period and belong to this file tag. Then a list of all files is sent to the server and all files not present on the server are requested from the requested from the device.
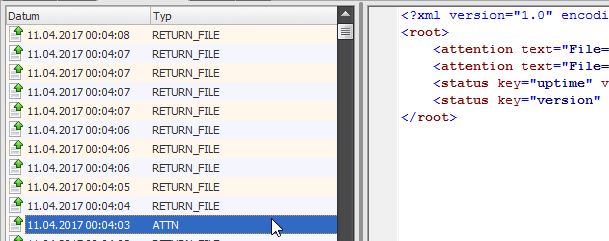
Status messages
The "Status messages" tab shows the incoming messages from the device. These
are displayed in the overview with the date and type of message. If you select a message, the exact
the exact content is displayed in the main screen. In the case of a PING, the usual vital signs of the
device, such as location, runtime and temperature. ATTN reports to the server that the device
has new data ready. And RETURN_FILE is the incoming data from the device when it receives a
corresponding request from the server in its mailbox.
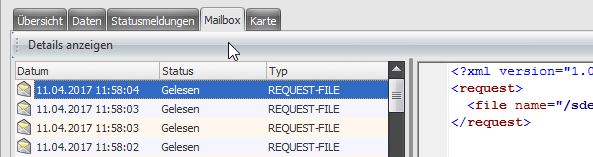
Mailbox
Under the "Mailbox" tab, we can now see the messages that the server has for the device. It is
When the server returned this message, whether the device has already read it,
and what type of message it is. The content of these messages can be viewed again
be viewed by clicking on them.
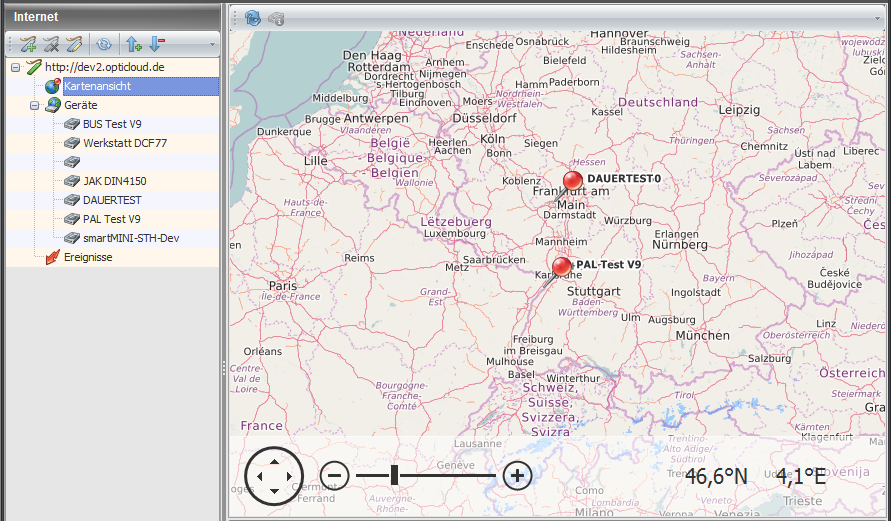
Map
With the last tab "Map" you can display the status entries on a map using the GPS data supplied with them. on a map. The last position coordinates of the device are then displayed on the map. device are displayed on the map.
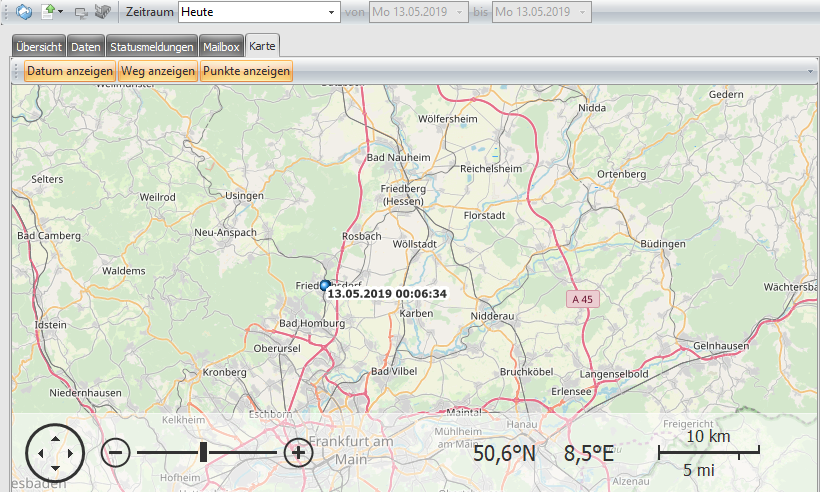
Map view
The map view visualizes the locations of the devices that are registered on the server as pins on a map. on a map.