Reports in optiCLOUD
Reports are a tool with which you can gain far-reaching insights into the raw data or already calculated data of your connected IoT devices. We offer various report types to meet your requirements. The reports that are generated for individual devices can also be viewed in the detailed area of the respective device under "Reports" in addition to the reports table. However, reports that have been generated across several devices are also displayed in the Reports area.
The various report types and their purposes are explained below.
Create report
To create a report, click on the Create button in the button bar. The Report Wizard is then started, which guides you through the configuration of the report.
- Report type: Select the desired report type from the list of available options.
- Example alarms report: Select the different alarm categories to be included in the report.
- Time range: Define the time period for which the report is to be created.
- File name: Enter a name for the report that the finished report file should have.
- Device selection: Select the one or (depending on the report type) the devices to be included in the report.
- Confirm
The exact steps differ depending on the selected report. For example, an OSF report has an additional step in which you can specify the channels to be included in the report.
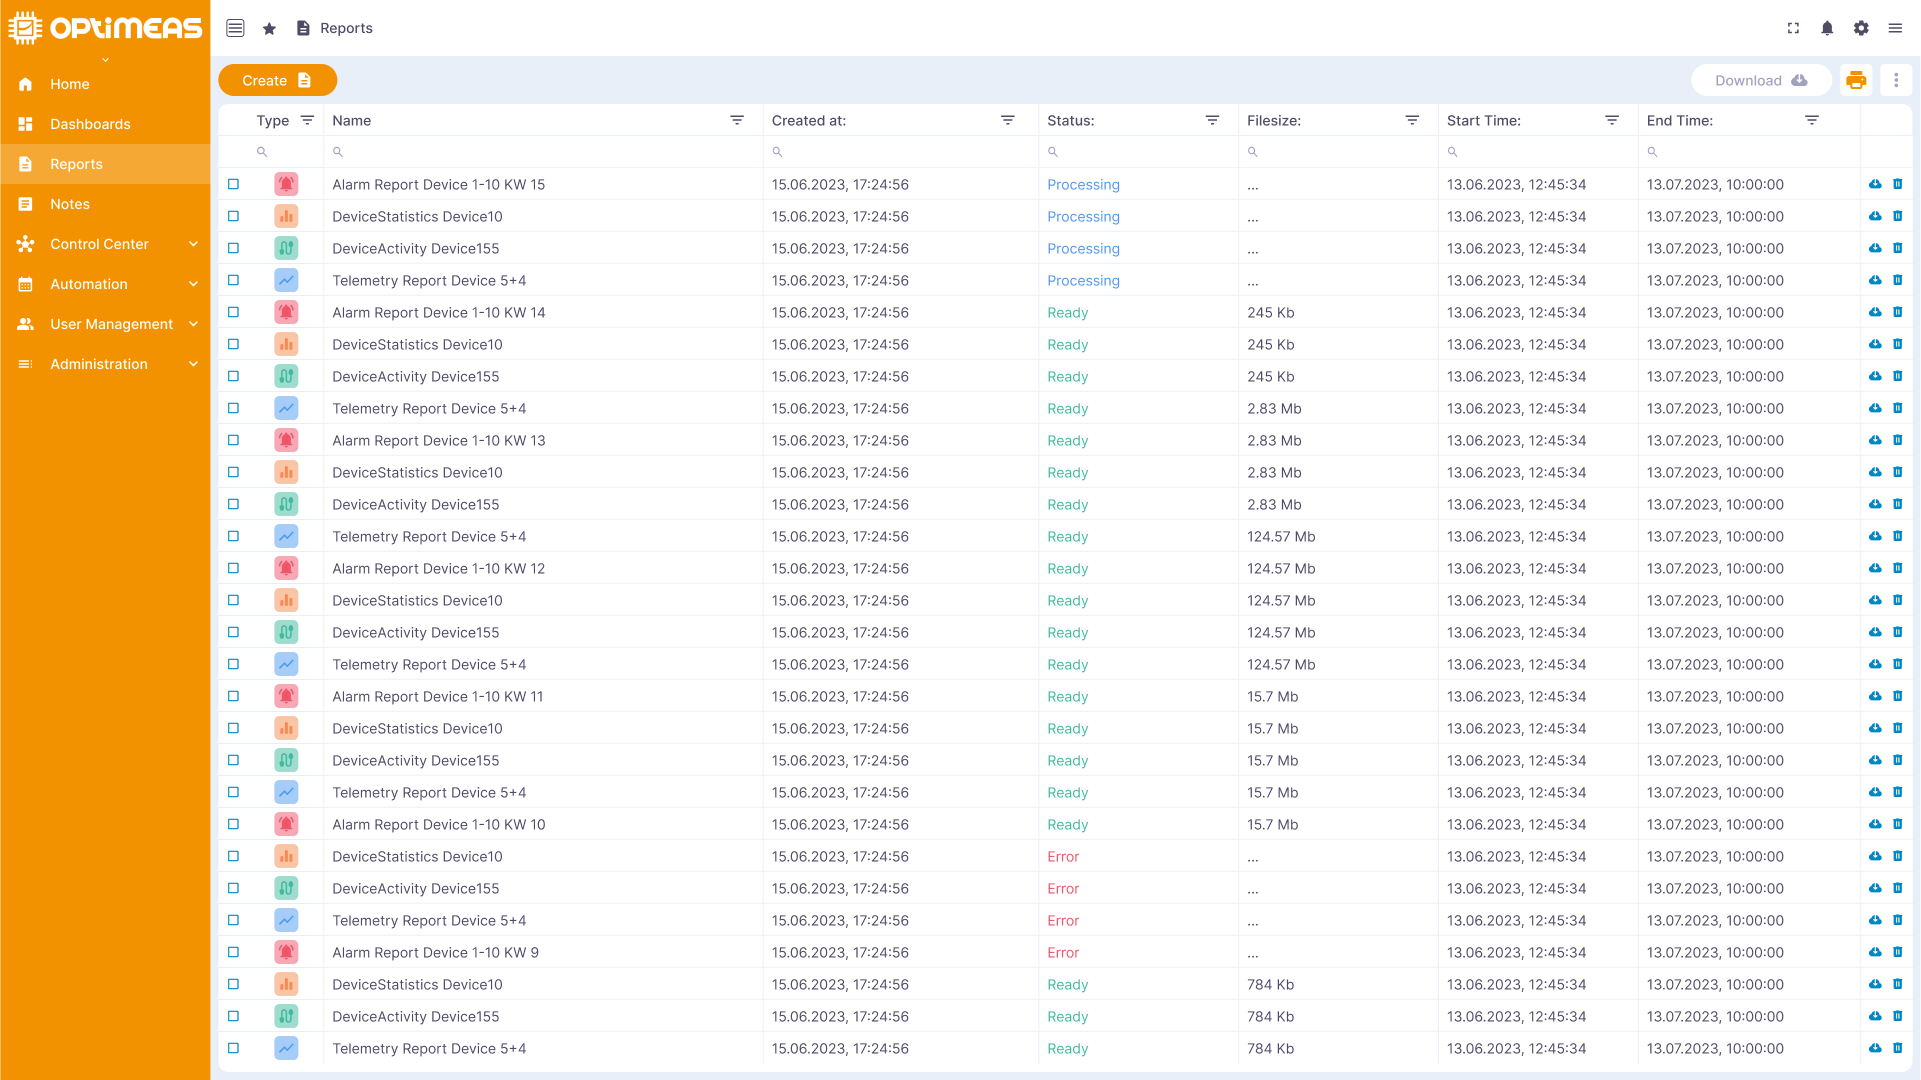
As soon as you have provided this information, you can generate the report. It will then be displayed in the report table with the status ...in progress. When the report is completed, the status will change to Successful.
The completed report is available for download as a .zip file after successful completion.
If the report is not completed with Successful, but is aborted with the status Error, please check the settings you entered in the configuration wizard. If you do not recognize any anomalies here, please contact support.
Please note that the creation of a report can sometimes take a long time, depending on the scope of the report to be created. A report on 1 connected device and the data of the last hour should be available in a few seconds.
An OSF report can sometimes take hours, depending on the amount of data to be processed, which results from the combination of the number of data channels, sampling rate of the data channels, selected time range and number of devices.
Report types
| Type | Icon | Description |
|---|---|---|
| Alarms |  | The alarm report provides an overview of the alarms of one or more of your IoT devices. This report allows you to export historical alarm data summarized in a single file to document them or to examine them separately. |
| DeviceStatistics |  | The Device Statistics report provides a selection of statistical information about one or more devices. You can view key figures such as operating hours, average values and much more to better understand the performance of your devices. |
| Device Activity |  | The Device Activity report shows the connection activity of your devices. This allows you to monitor the availability and stability of your devices. |
| Telemetry |  | The telemetry report allows you to export the data sent by the devices via MQTT over historical time ranges. |
| OSF Data |  | optiMEAS Function In the OSF data report, you can select individual or all measurement channels to export the raw data from the devices, which is sent in the form of .OSF files. This allows you to analyze very detailed information about events or processes. |
| Jasper |  | The Jasper report is based on a Jasper template to be imported. Jasper is a widely used reporting tool that allows you to create customized reports that meet your specific requirements. The documentation on how to create a Jasper report template will follow shortly. |