Getting Started
Getting Started
This chapter guides you through a typical first steps process in optiCLOUD. The goal is to create your first device, connect it to the platform, check incoming data, and then display it in a simple visualization.
Goal of the Introduction
By the end of this guide, you will have:
- created your first device in optiCLOUD
- retrieved the device token and entered it into your actual device or gateway
- verified the first data in the platform
- optionally created your first DeviceView
- set up your first Dashboard with a simple data visualization
Prerequisites
To get started, you should have the following:
- a user account with access to a tenant in optiCLOUD
- sufficient permissions to create and view devices and dashboards
- a real device or a test system capable of sending data to optiCLOUD
- for OptiMEAS devices, optionally optiCONTROL for configuration
This guide is not specific to any particular device. An OptiMEAS device such as a SmartMINI can be used as a practical example, but the basic principle applies equally to other devices or custom integrations.
Overview After Login
After logging in, users are first directed to the home page. There, key metrics and quick access links for the current tenant are displayed.
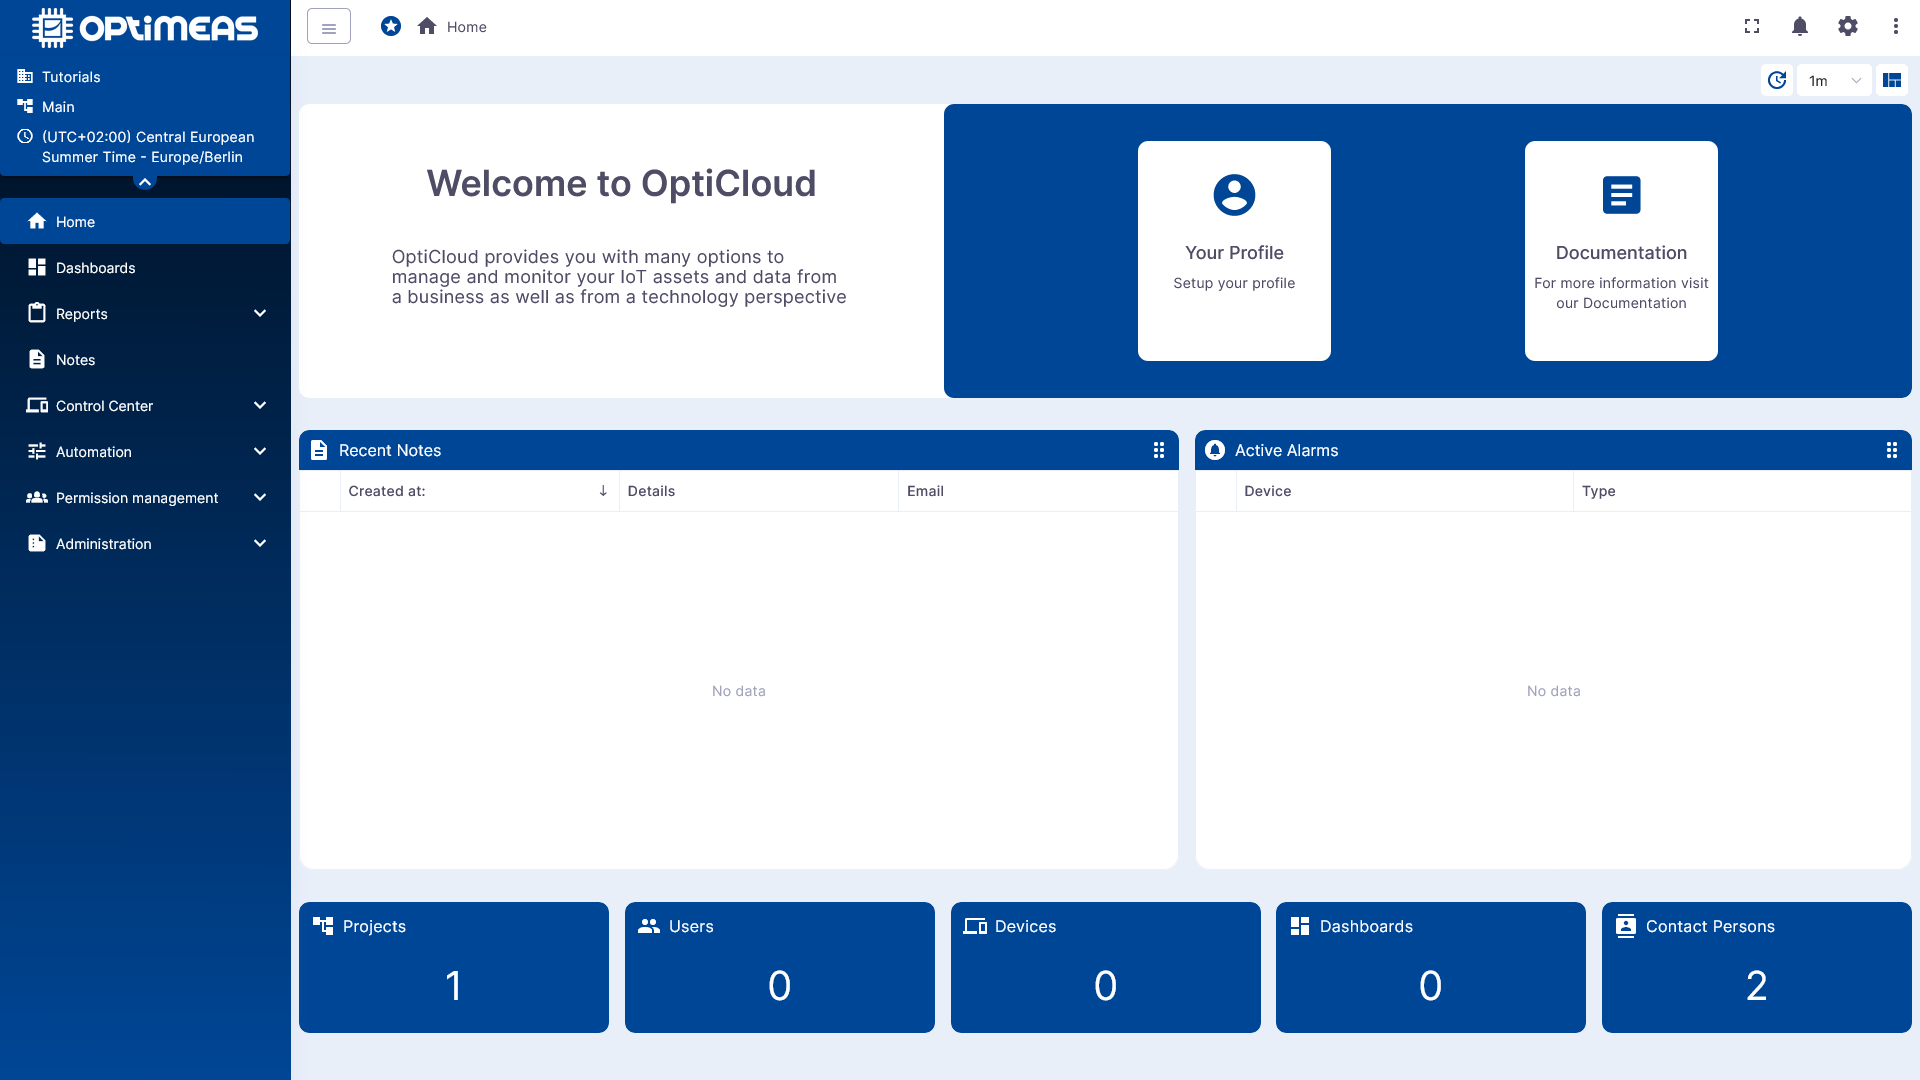
The following sections are particularly relevant for getting started:
- Home for a general overview
- Control Center for devices and device views
- Dashboards for visualizations
- User Menu for profile, tenant information, and API description
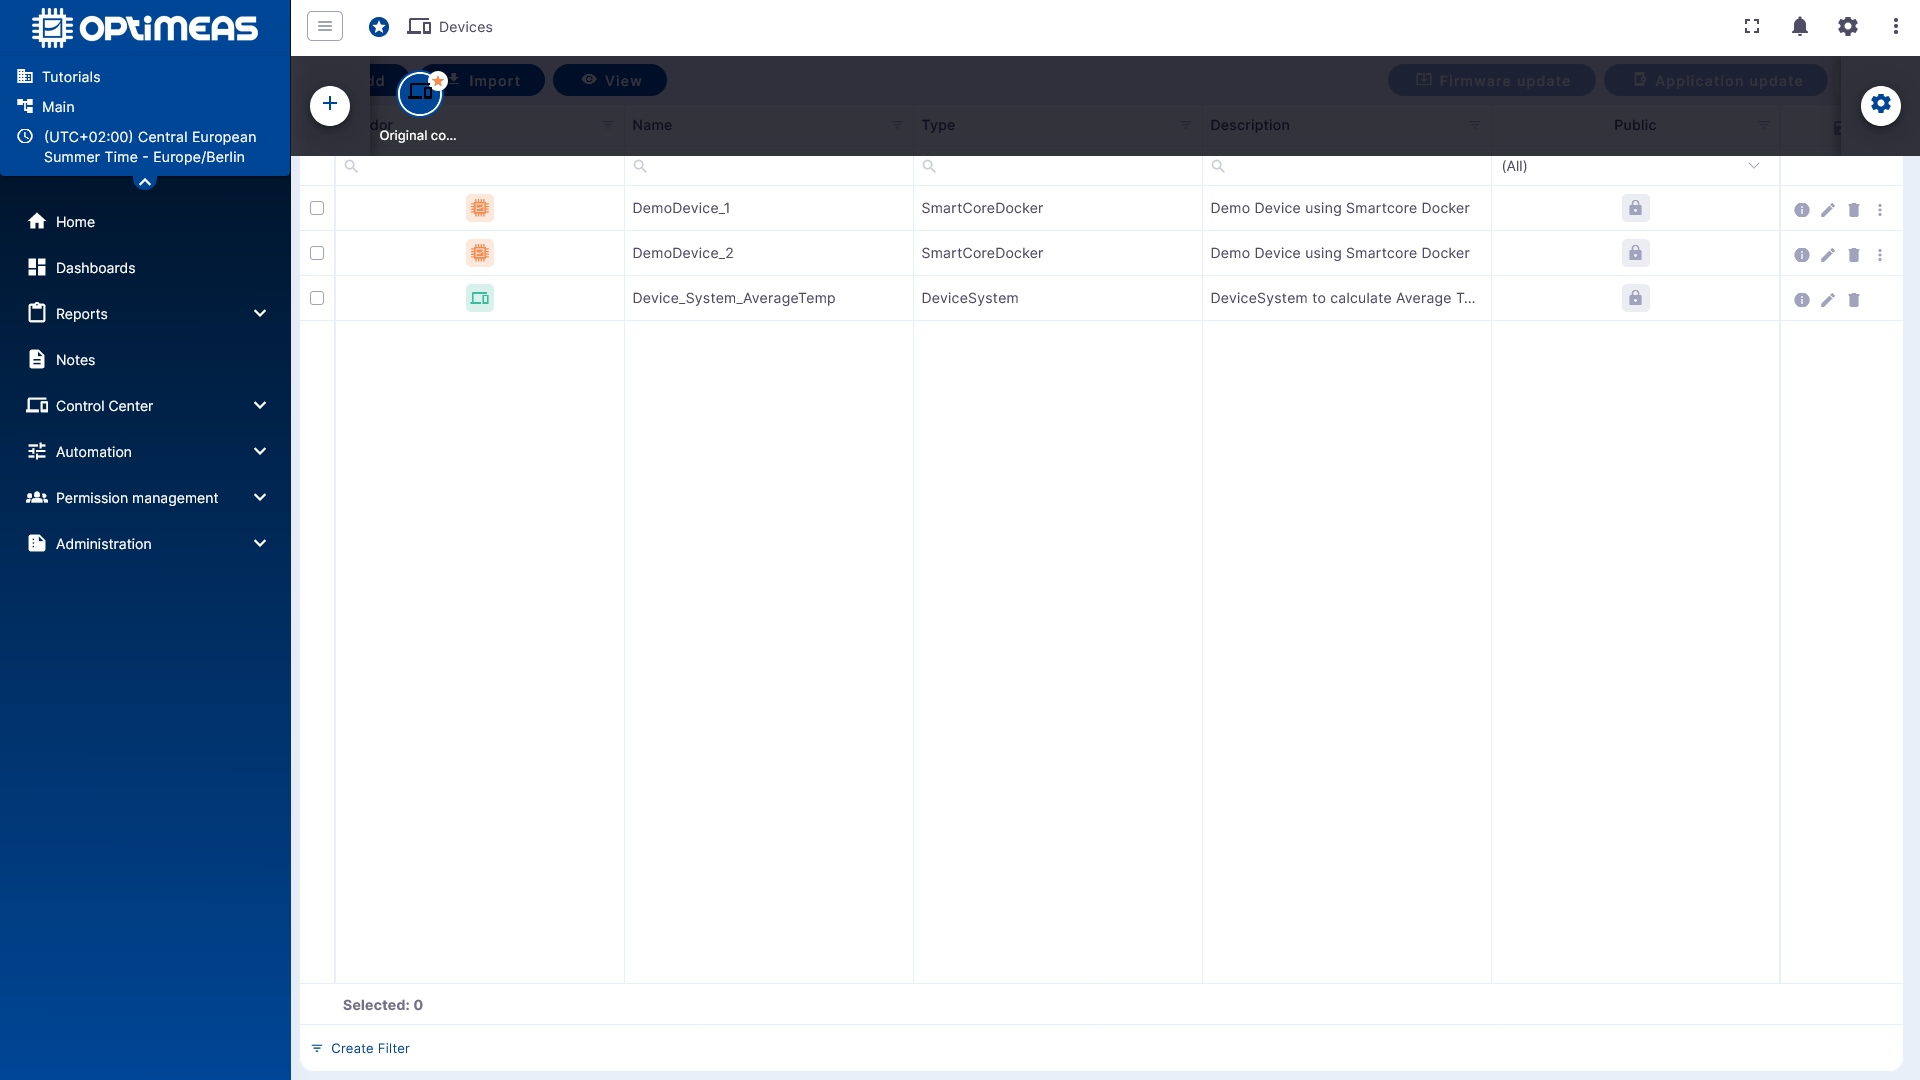
Step 1: Create your first device
First, navigate to the Control Center section. This is where your tenant’s device inventory is managed.
To get started, simply create a new device with the basic information:
- Name
- Device type
- Optional label or description
You can choose any name you like to start with. The only important thing at this stage is that a device is created as a digital twin for the real device.
After creating the device using the button in the upper-left corner and completing the "Create Device Wizard," you can open the device directly. The detail view consolidates the sections that will be relevant later, such as Attributes, Telemetry, Storage, Communication, and Security.
For more information, see the Device documentation:
Step 2: Retrieve the device token
Next, open the Security section in the Device. There you will find security-related device information, in particular the access token for authenticating the device with the platform.
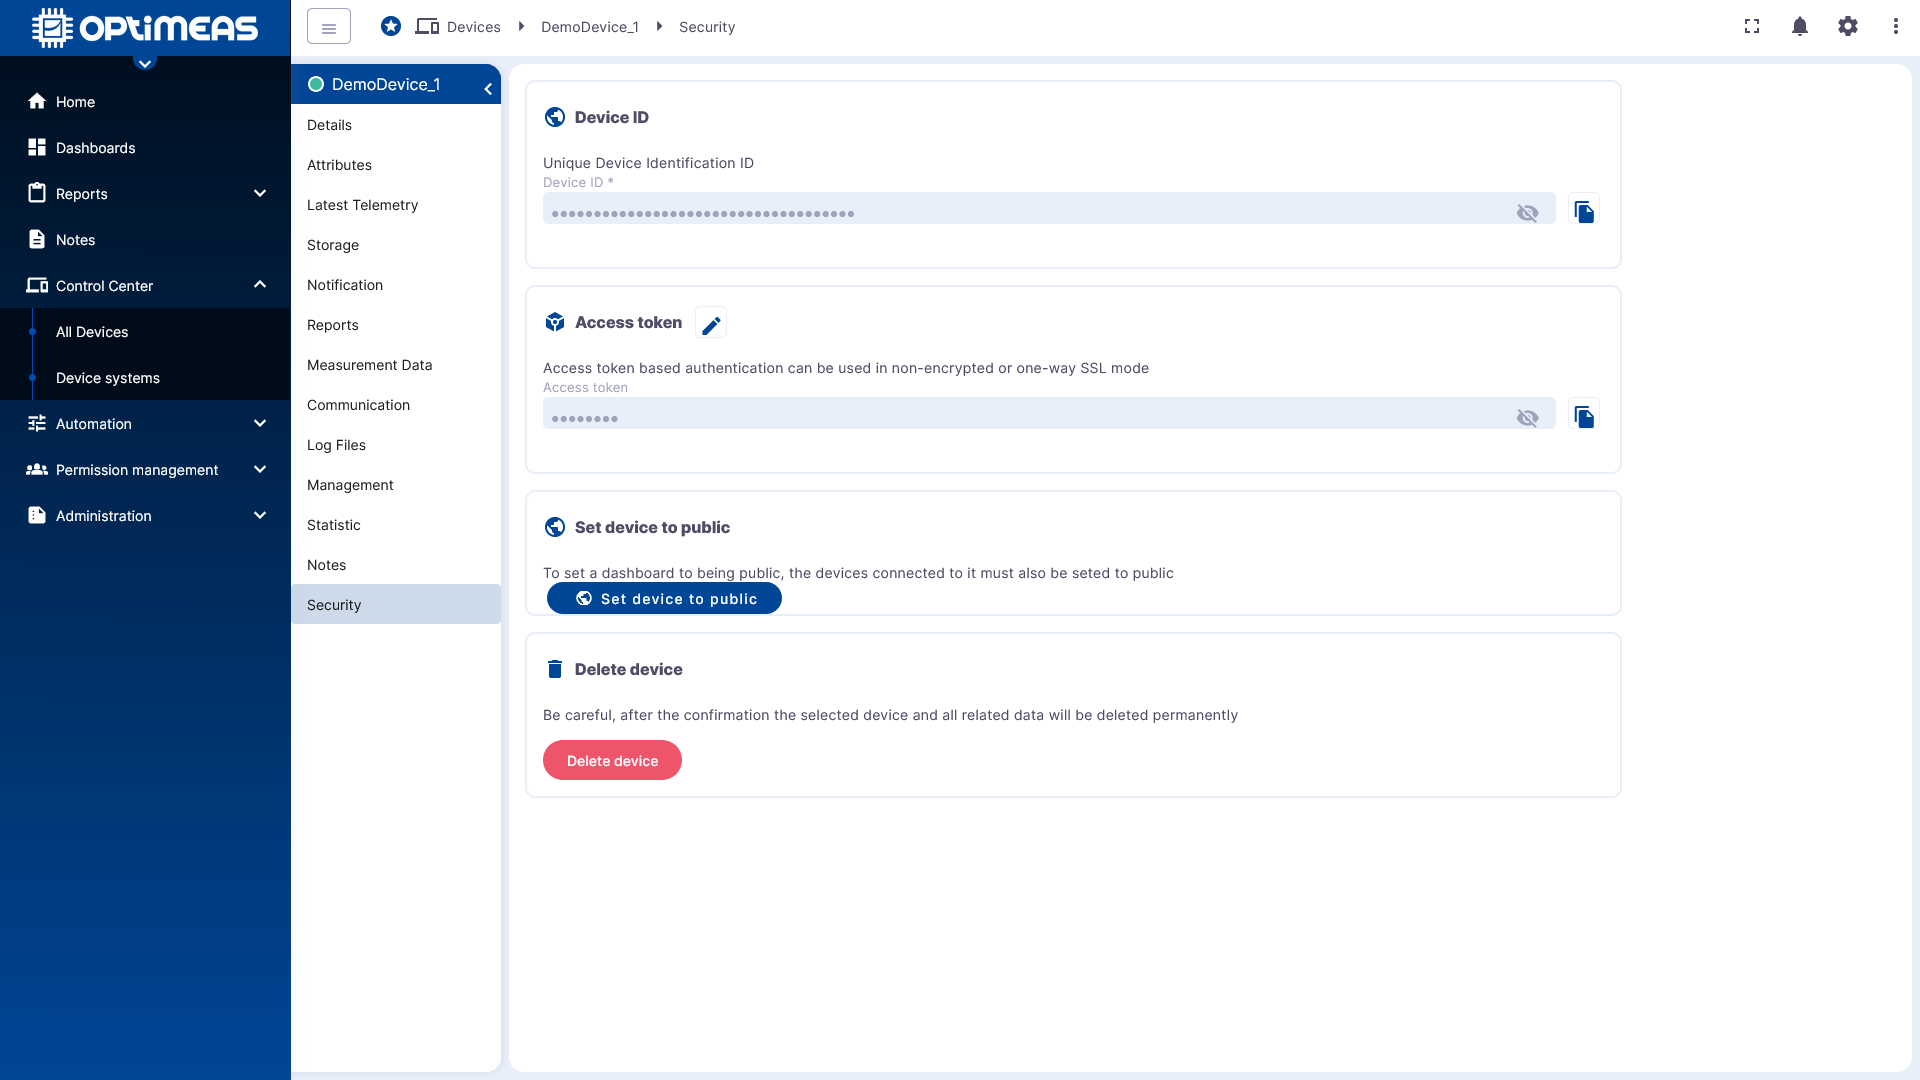
This token is required so that the physical device can send data to optiCLOUD. Copy the token from the interface using the provided function.
Step 3: Configure the physical device
Now configure the physical device or gateway so that it transmits data to optiCLOUD.
For OptiMEAS devices, this is done via optiCONTROL. Among other things, the server address, transmission interval, and device token are stored there.
If MQTT is also used, the following generally applies:
- Encrypted MQTT connection via
ssl://<host>:8883 - Access token as authentication credential
If you are connecting your own device or script instead of an OptiMEAS device, the API is the right starting point. Both REST and MQTT examples are documented there.
Step 4: Checking Incoming Data
Once the device successfully sends data, you can check it directly in the Device. To do this, open the Current Telemetry Data section.
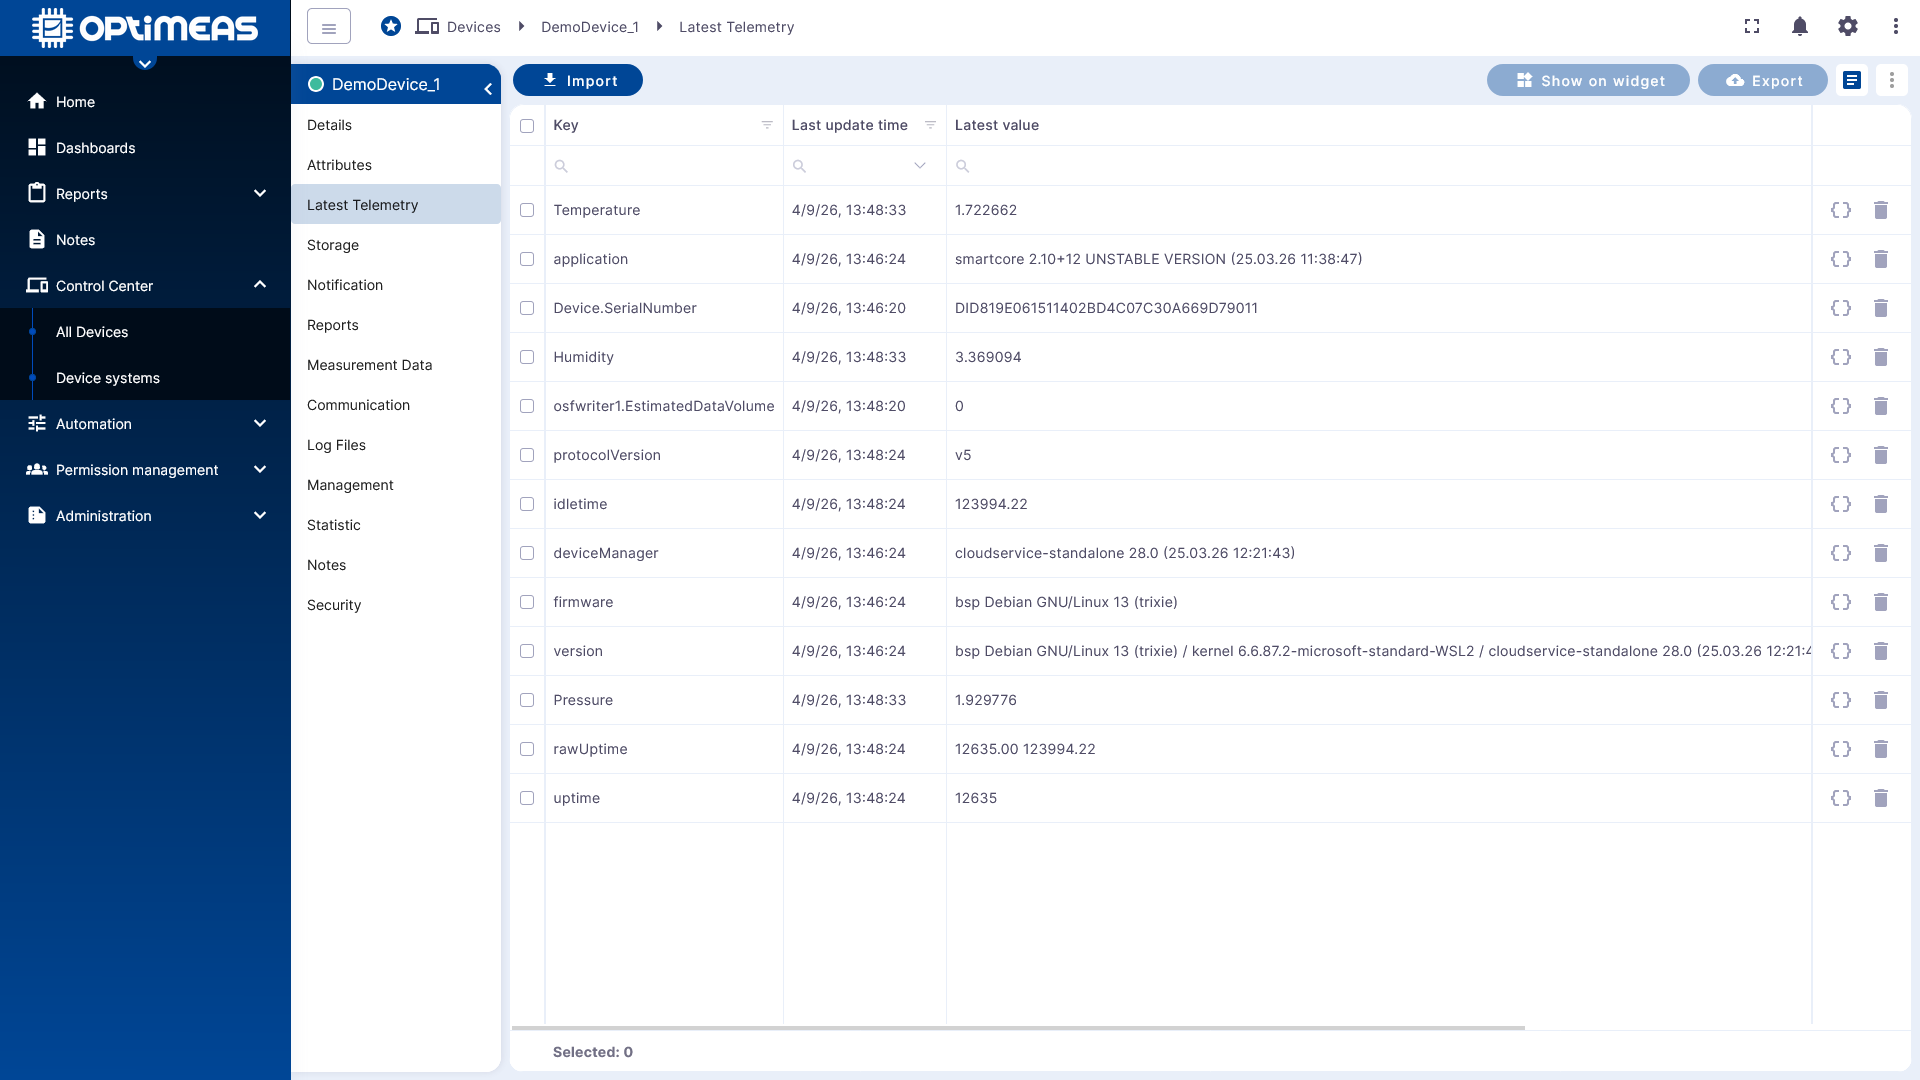
Here you can quickly see:
- whether any data is arriving at all
- which channels are transmitting
- what the latest value is for each channel
- when the last update occurred
If no values are visible at this point, you should first check the device connection:
- Is the server host correct?
- Is the token correct?
- Was the device connected to the correct tenant system?
- Is the correct protocol being used?
For technical checks, the Communication section in the device and the API Description are also helpful.
Step 5: Optionally create a DeviceView
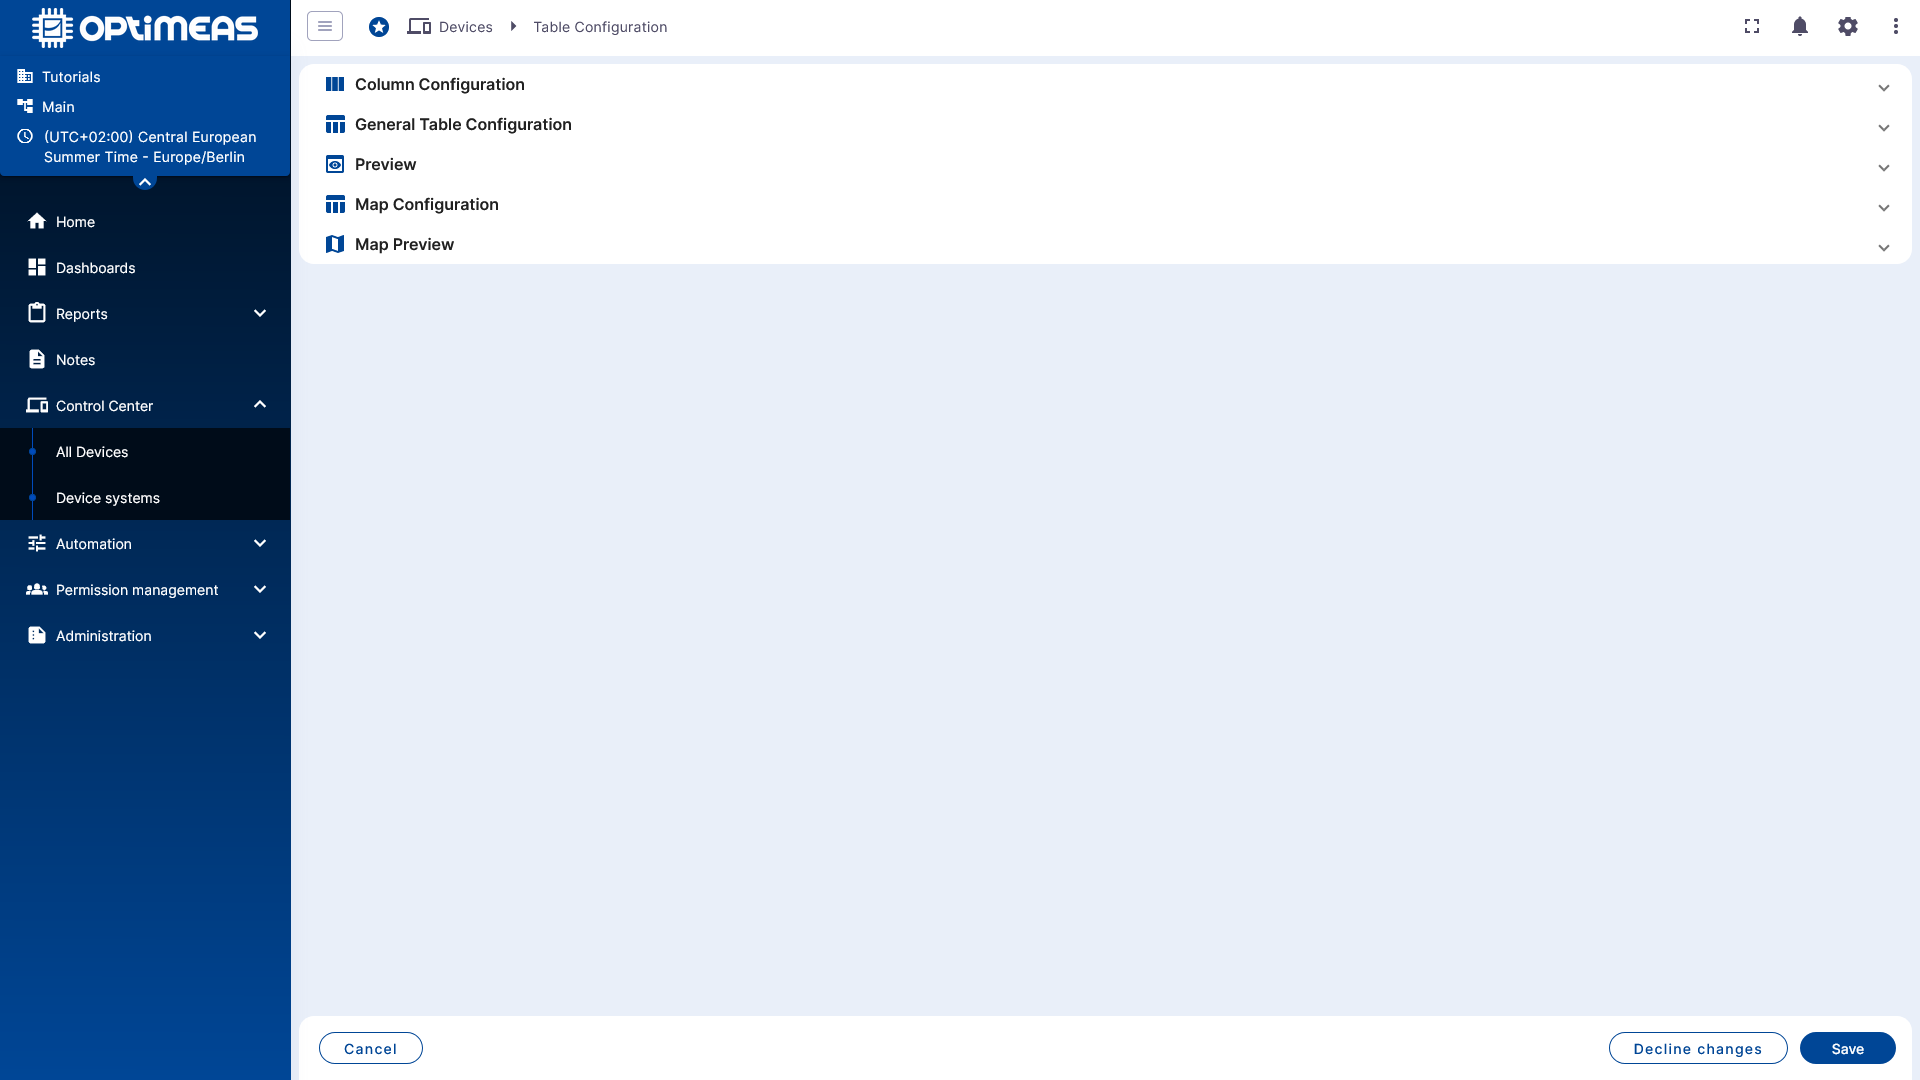
Even before a dashboard is set up, it can be useful to create an initial device view in DeviceView. This allows you to consolidate multiple pieces of device information into a clear table.
You can switch between existing views or add new ones via the view management.
In the configuration dialog, you can then specify which columns, actions, and general table settings the view should contain.
Typical use cases for an initial DeviceView include:
- Monitoring communication status
- Overview of firmware or version statuses
- View of central telemetry or attribute values
The complete description can be found under DeviceView.
Step 6: Create your first dashboard
For historical or graphical visualization, switch to the Dashboards section.
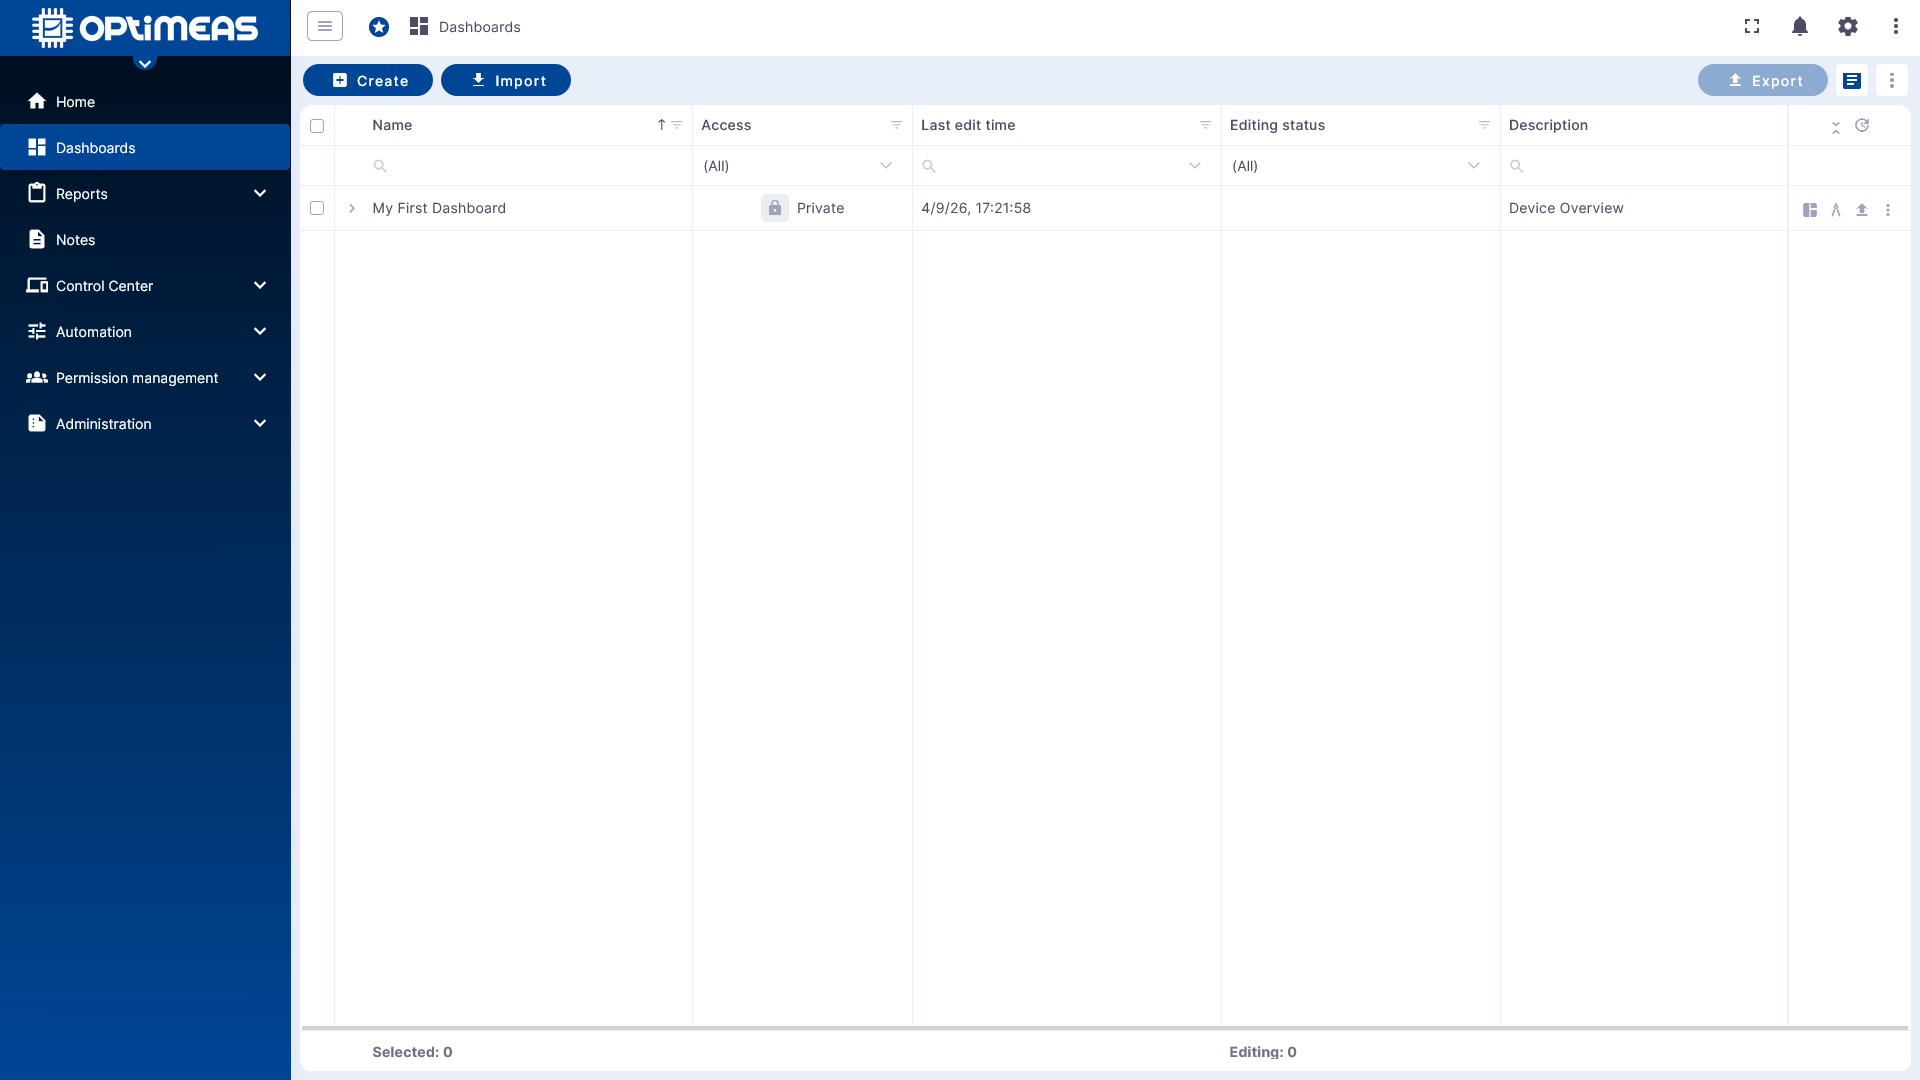
Create a new dashboard there. To get started, a name and, optionally, a description are sufficient.
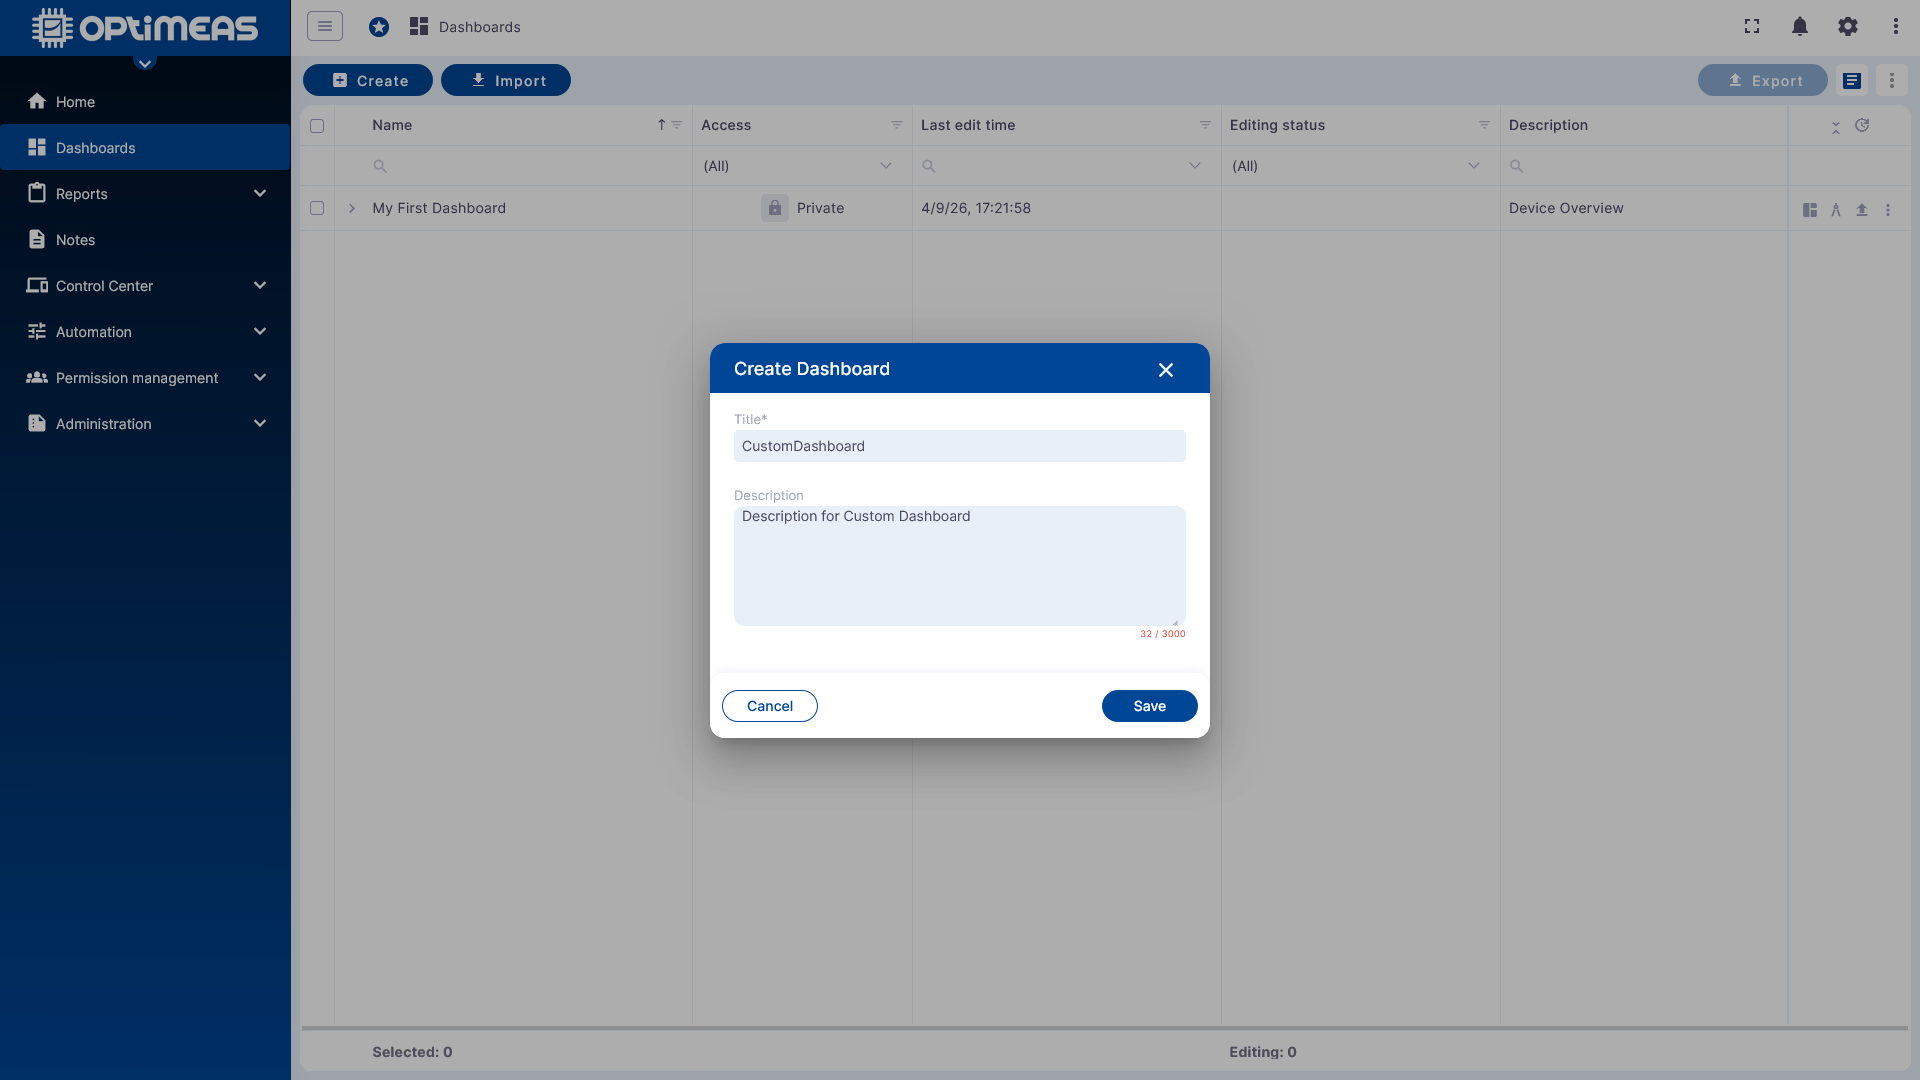
After creating it, the dashboard opens directly in edit mode.
Step 7: Create an alias
A new dashboard is initially empty. Before a widget can be populated with data, an alias is typically created. This alias refers to the device or group of devices whose data is to be visualized.
To get started, an alias of the type Single Object or Single Device that points to the device you just created is sufficient.
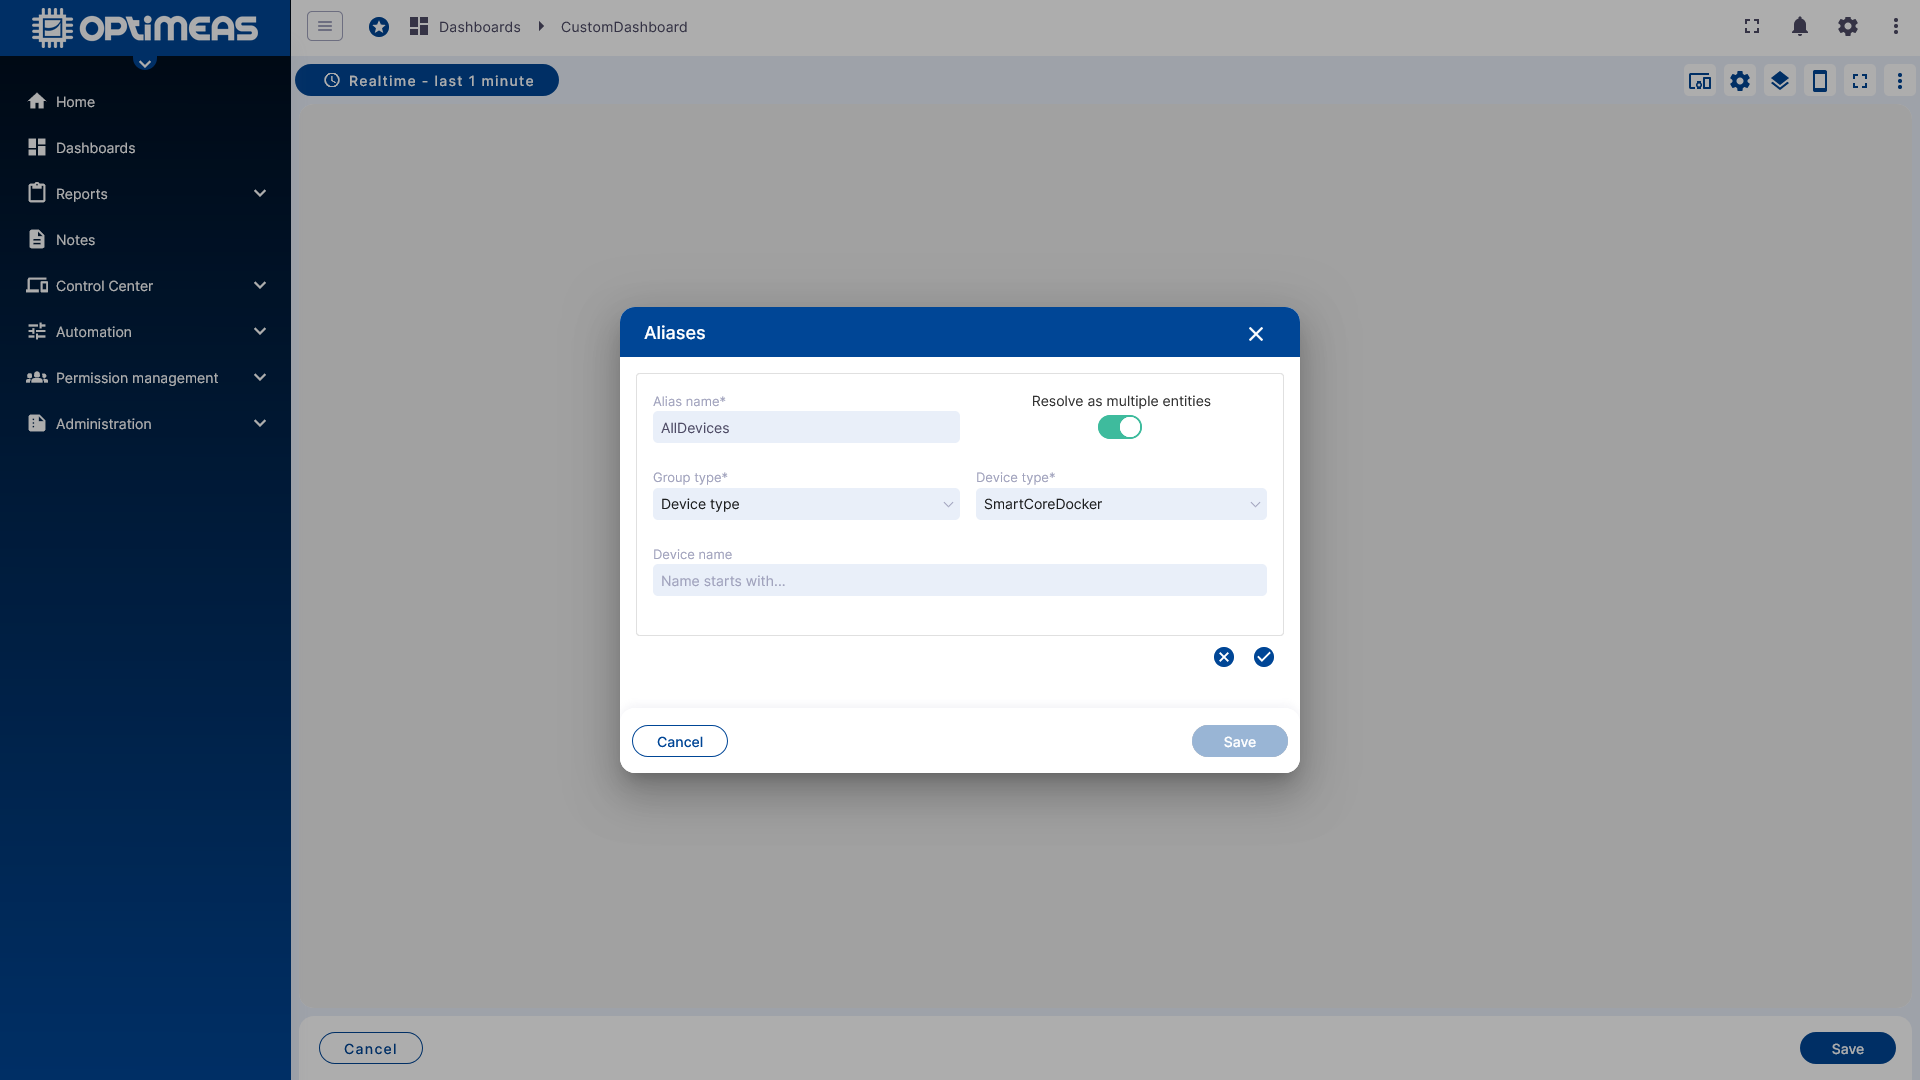
The advantage of this approach becomes particularly apparent when multiple devices need to be visualized together later on. Instead of having to select all devices again in each widget, the dashboard then uses the alias that was defined once.
For more background information, see Dashboards.
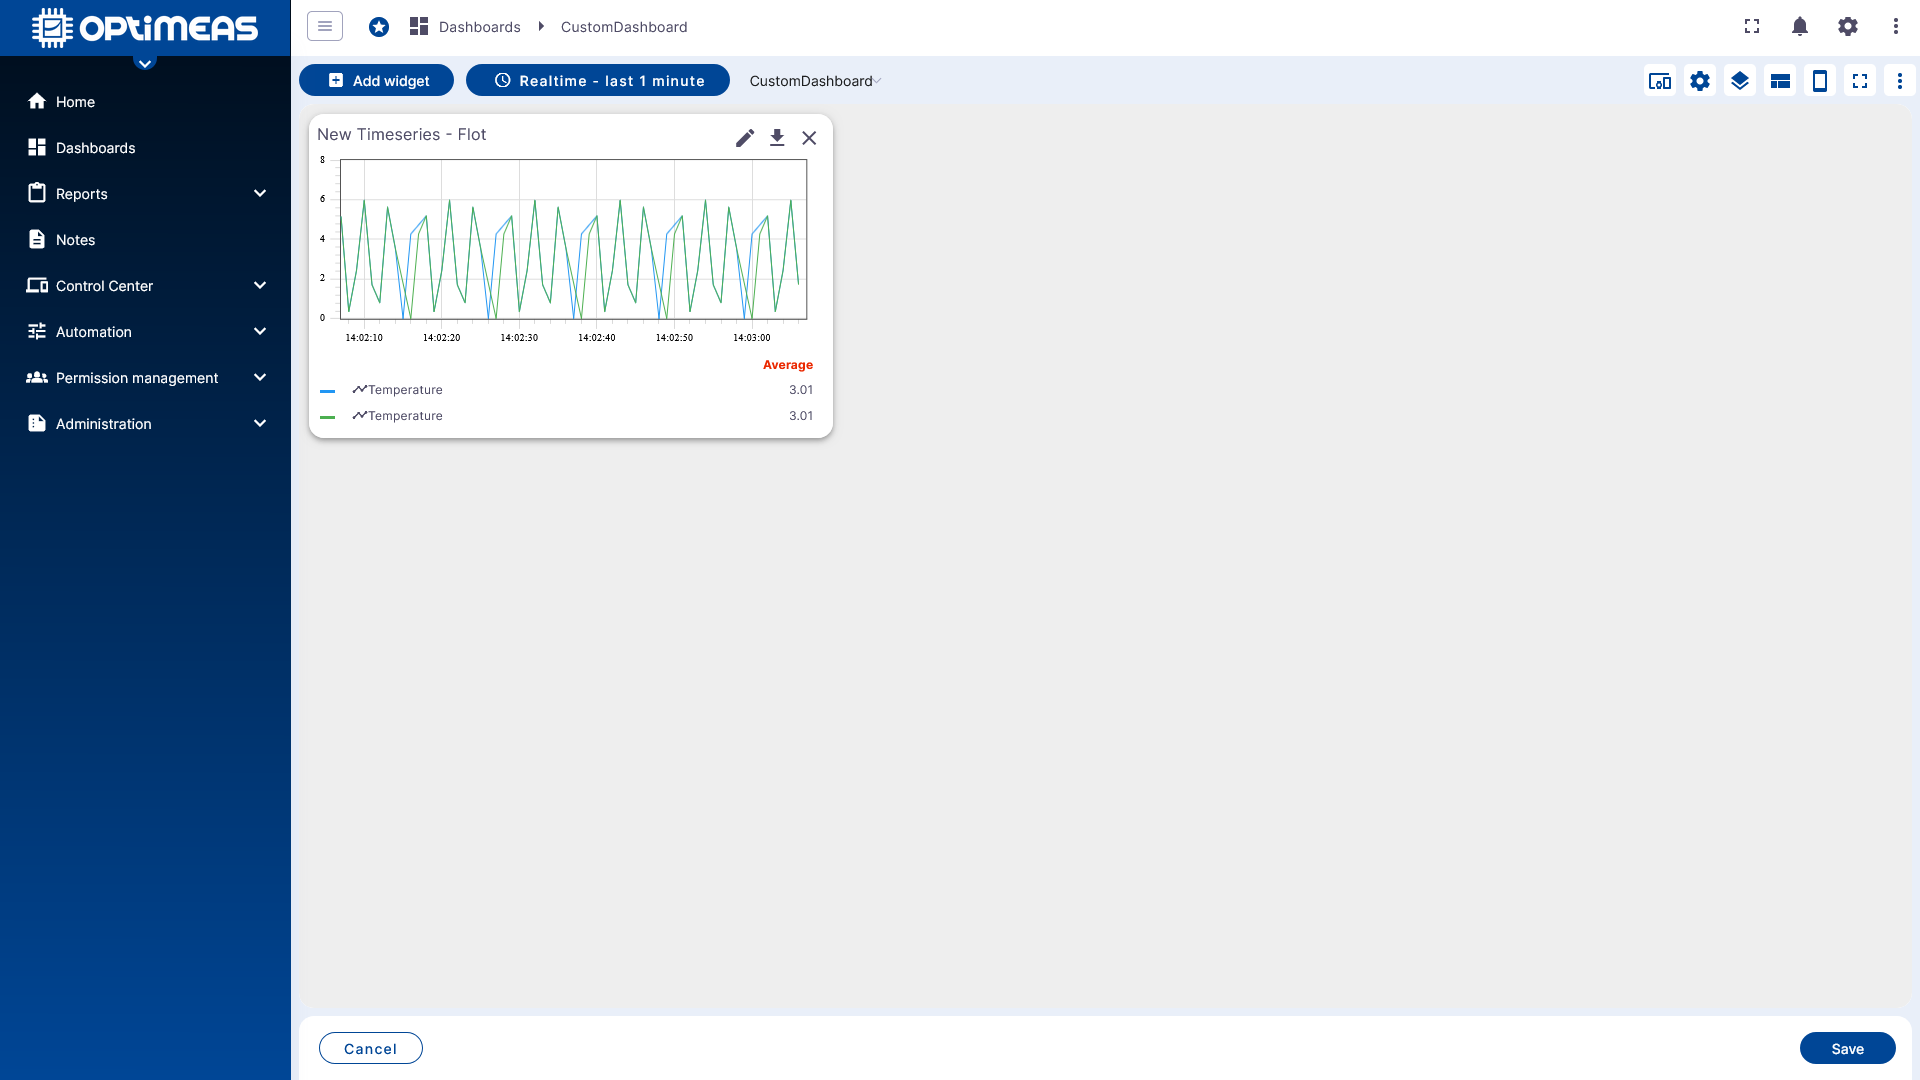
Step 8: Add the first widget
Once the alias has been defined, you can add the first widget. For a quick start, a simple chart or another standard visualization from the available widget bundles is a good choice.
In the widget, then select:
- the alias as the data source
- the desired telemetry channel
- if needed, a custom or global time window
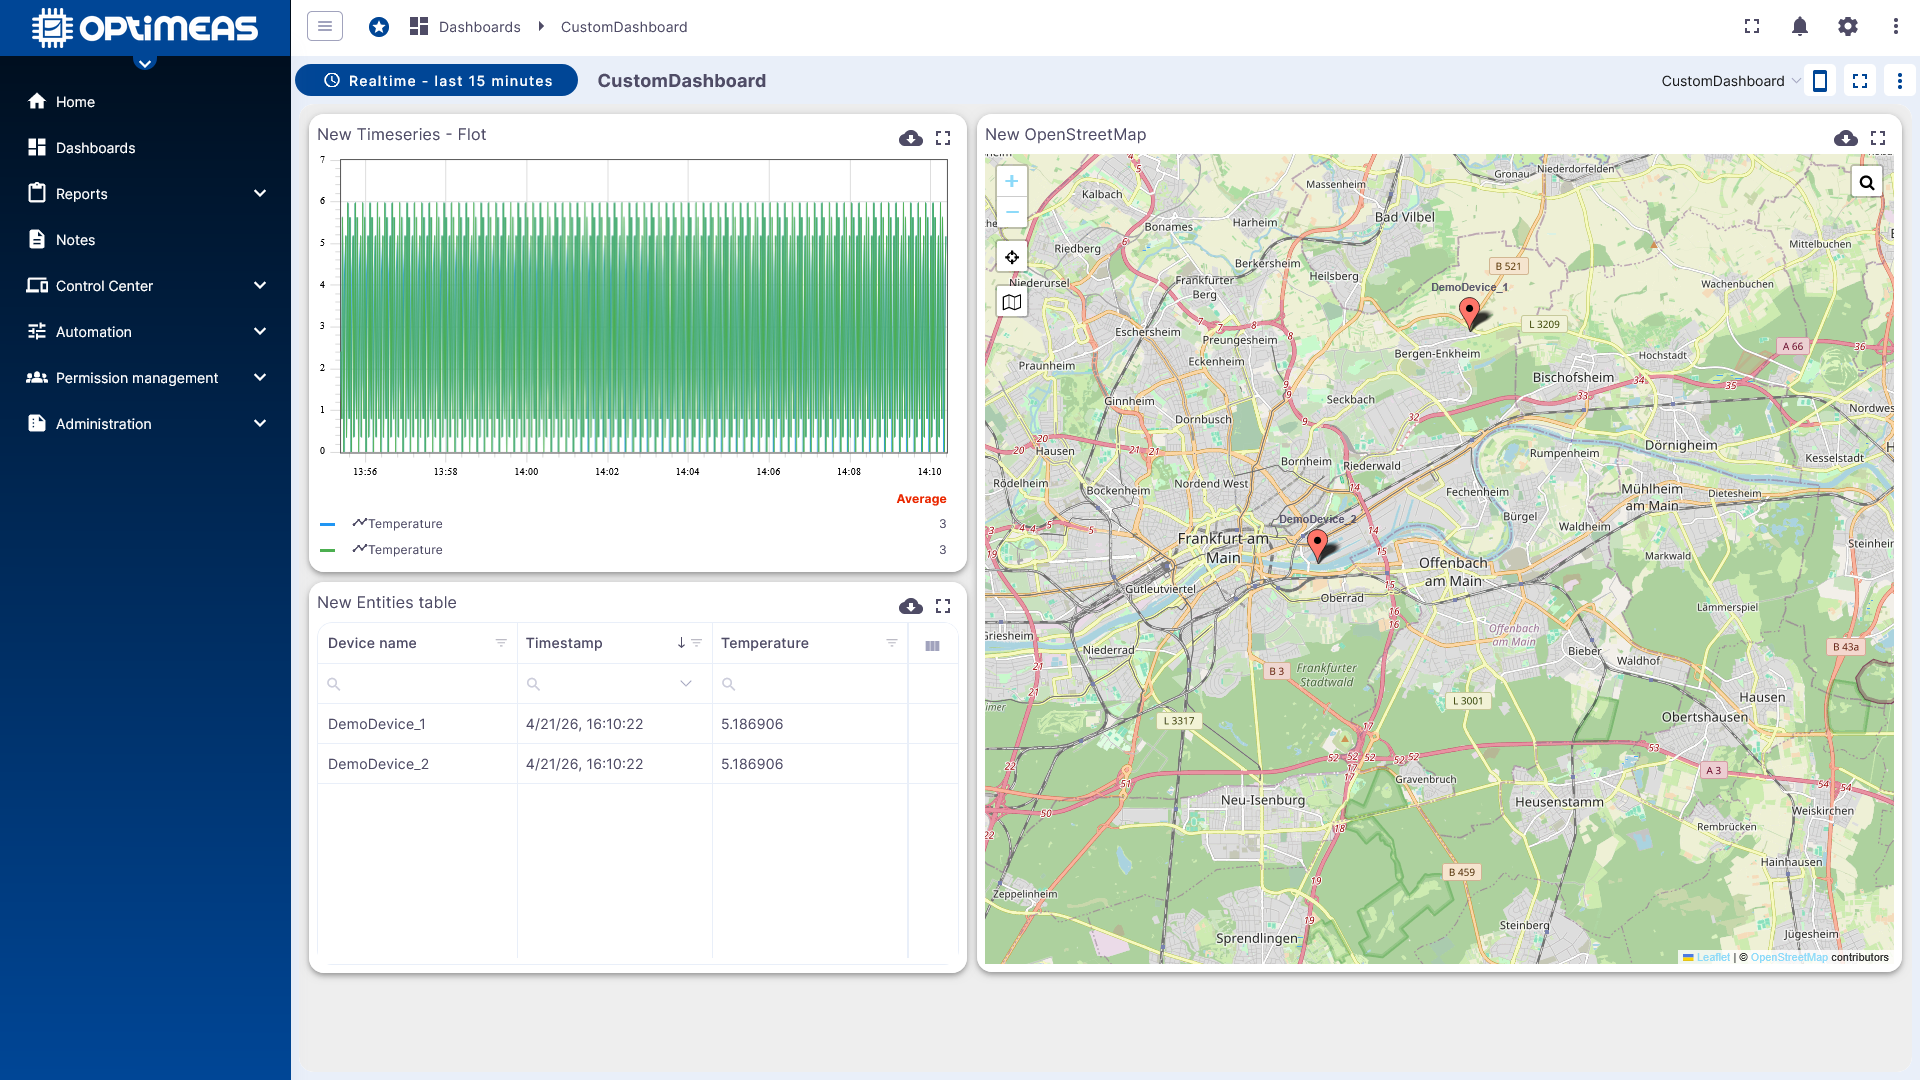
After saving, the first visualization appears directly in the dashboard.
As the dashboard is further developed, it becomes a complete overview page for your data.
Recommended next steps
Once the initial data is visible, the following sequence is generally recommended for further expansion:
- Name devices clearly and use device types consistently.
- Check the telemetry and attribute structure.
- Set up DeviceViews for work processes.
- Create dashboards for monitoring and presentation.
- Add automation or API integration as needed.
Relevant related chapters are: