Getting Started
Introduction
The aim of this tutorial is to successfully add a device to optiCLOUD and collect initial live data and visualize it in a quickly created dashboard.
This tutorial will show you the following steps:
-
Connect a device to optiCLOUD.
-
Transfer device credentials to your device
-
Transfer data from the device to optiCLOUD via MQTTS and HTTPS
-
Visualization of the data
Requirements
Since you are already in optiCLOUD, you have already successfully completed the initial login.
The next step is to connect the first device to optiCLOUD. For this tutorial we use a SmartMINI from OptiMEAS, as well as the optiCONTROL software or optionally the Terminal. However, there will also be a generally applicable explanation. You are therefore not tied to OptiMEAS devices in order to complete this tutorial.
Registration and overview
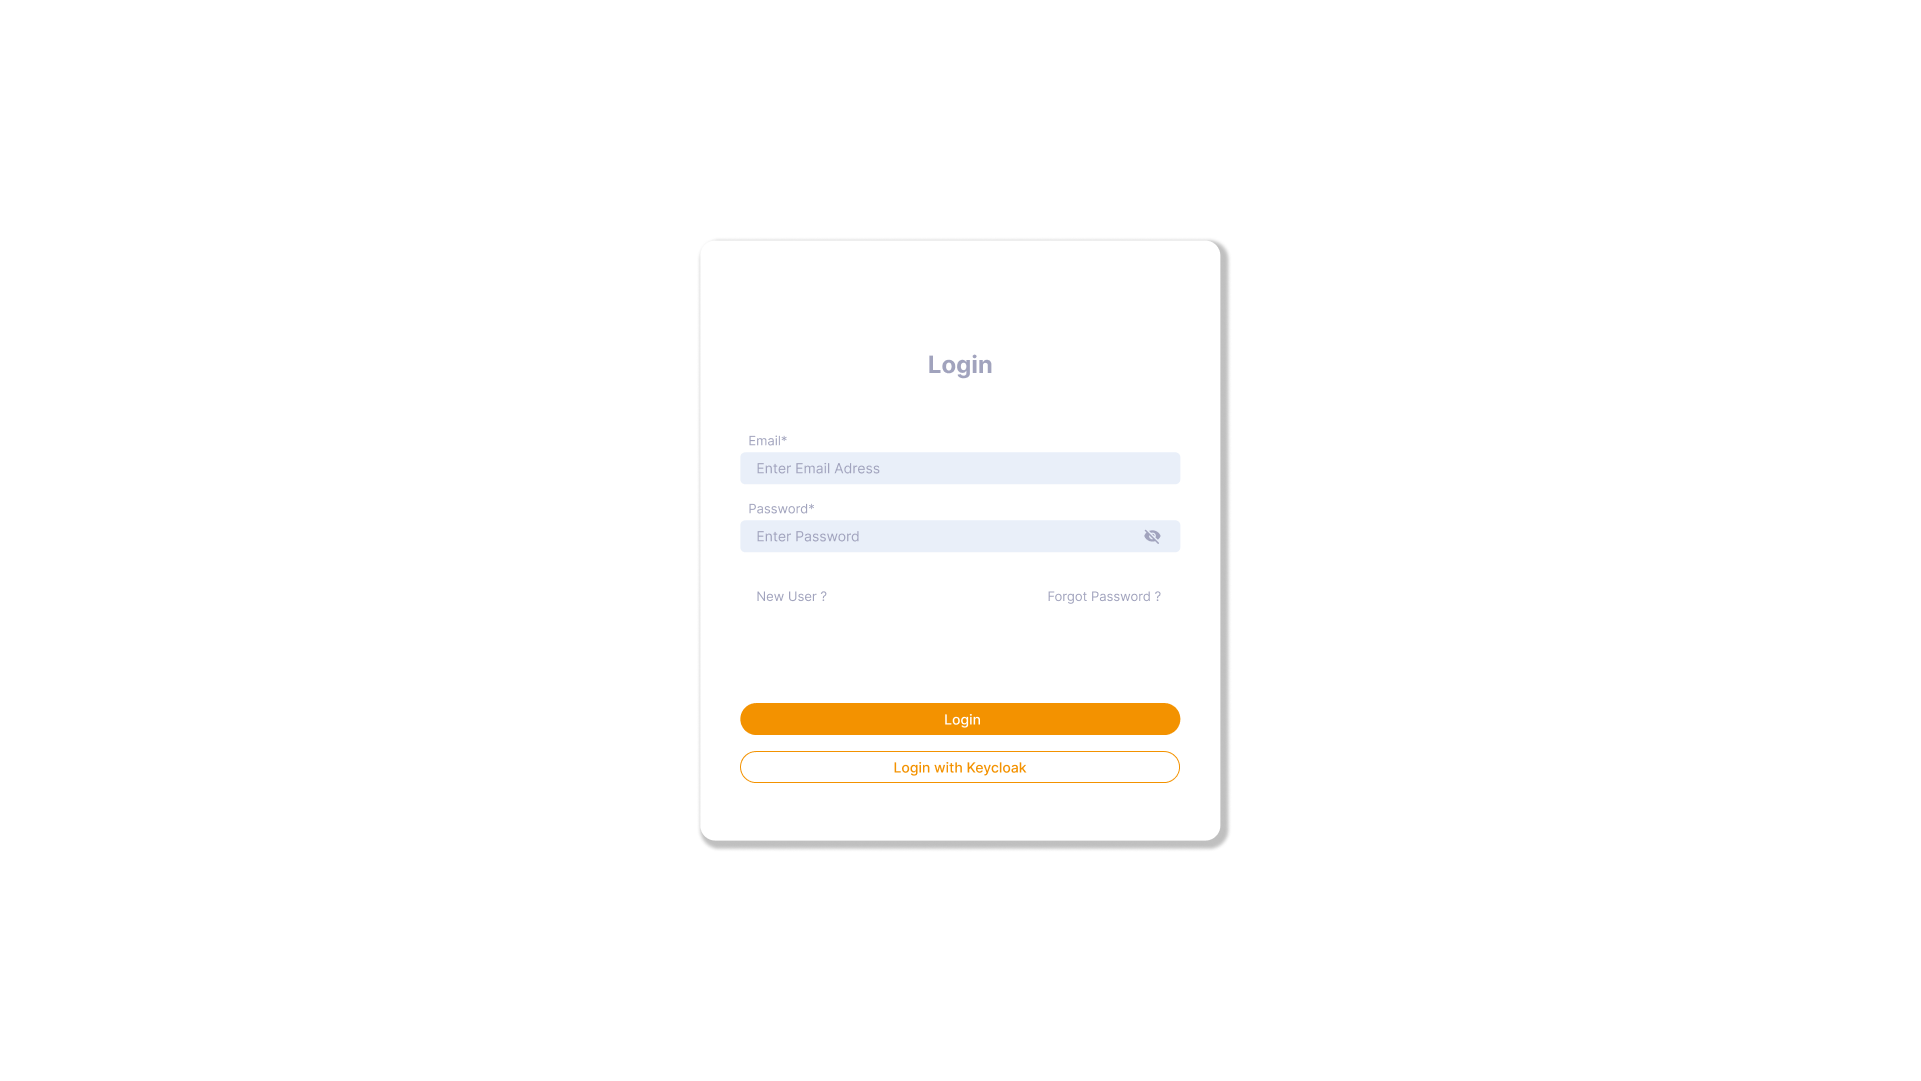
The first step, which you have already completed, is to log in to the optiCLOUD user interface.
Normally, a tenant has been set up for you, of which you are now the administrator. As the administrator of a tenant, you are also the contact person for all communication with the cloud operators.
The login information required for this is your e-mail address and a password created by you.
The user used in this tutorial is: documentation@OptiMEAS.de
-
Username: documentation@OptiMEAS.de
-
Password: -------------
Home screen
When you initially log in, you will be taken to an overview page that gives you an initial insight into your tenant. Here you can see basic information such as
Devices
- Number of devices already created
- Number of existing projects
- Number of occupied memory
- Number of all dashboards created
- Active alarms
- Last notes
- and much more.
This area is currently still largely empty, but it will fill up over time.
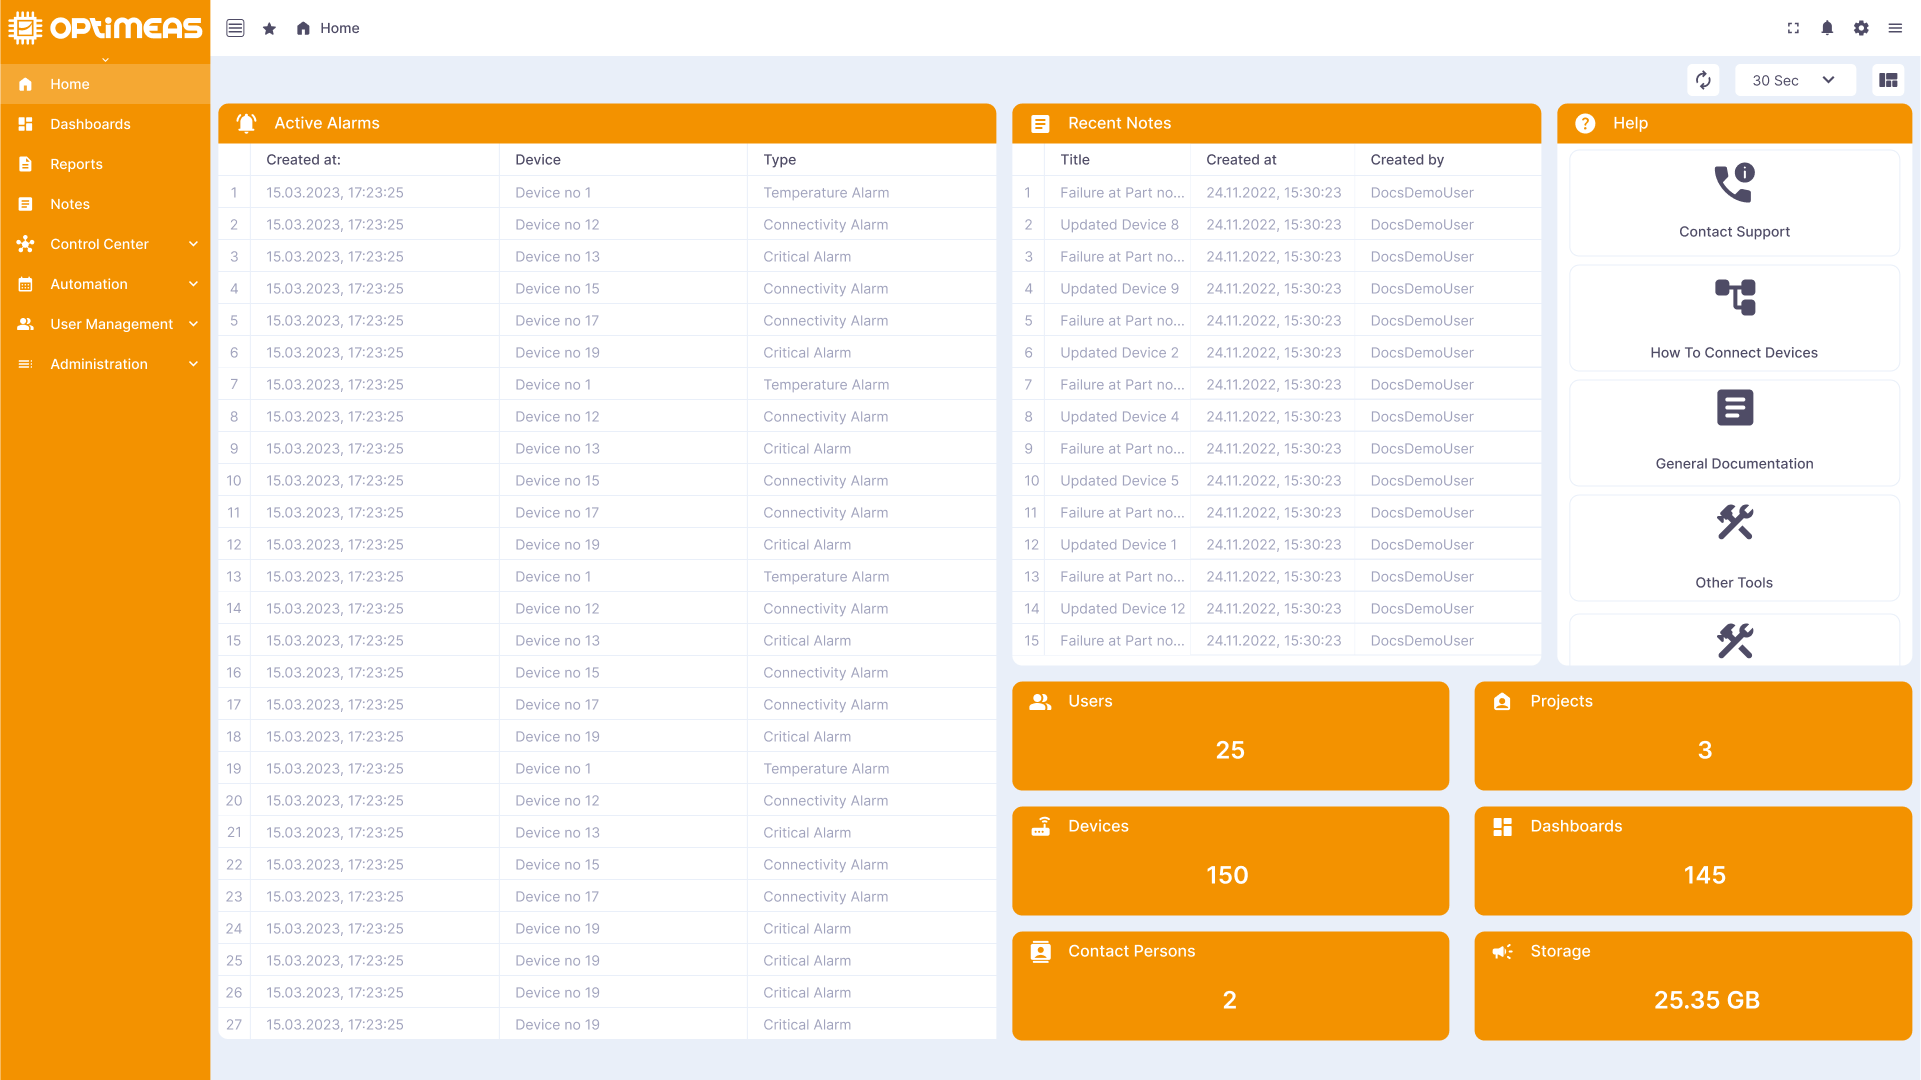
On the left-hand side of the screen, you will see the menu with its various areas containing different optiCLOUD functions. Depending on how your tenant has been set up, more or fewer areas will be available to you. However, the standard case and also the case of this tutorial includes the following areas:
- Home
- Dashboards
- Reports
- Notes
- Control Center
- Devices
- Automation
- Rule Chains
- Event Processing
- Scheduler
- User Management
- Projects
- Users
- User Permissions
- Permission Templates
- Administration
- Widget Library
- Administration
The respective areas are explained in more detail in the individual chapters of this documentation page.
The Devices and Dashboards areas are important for the tutorial.
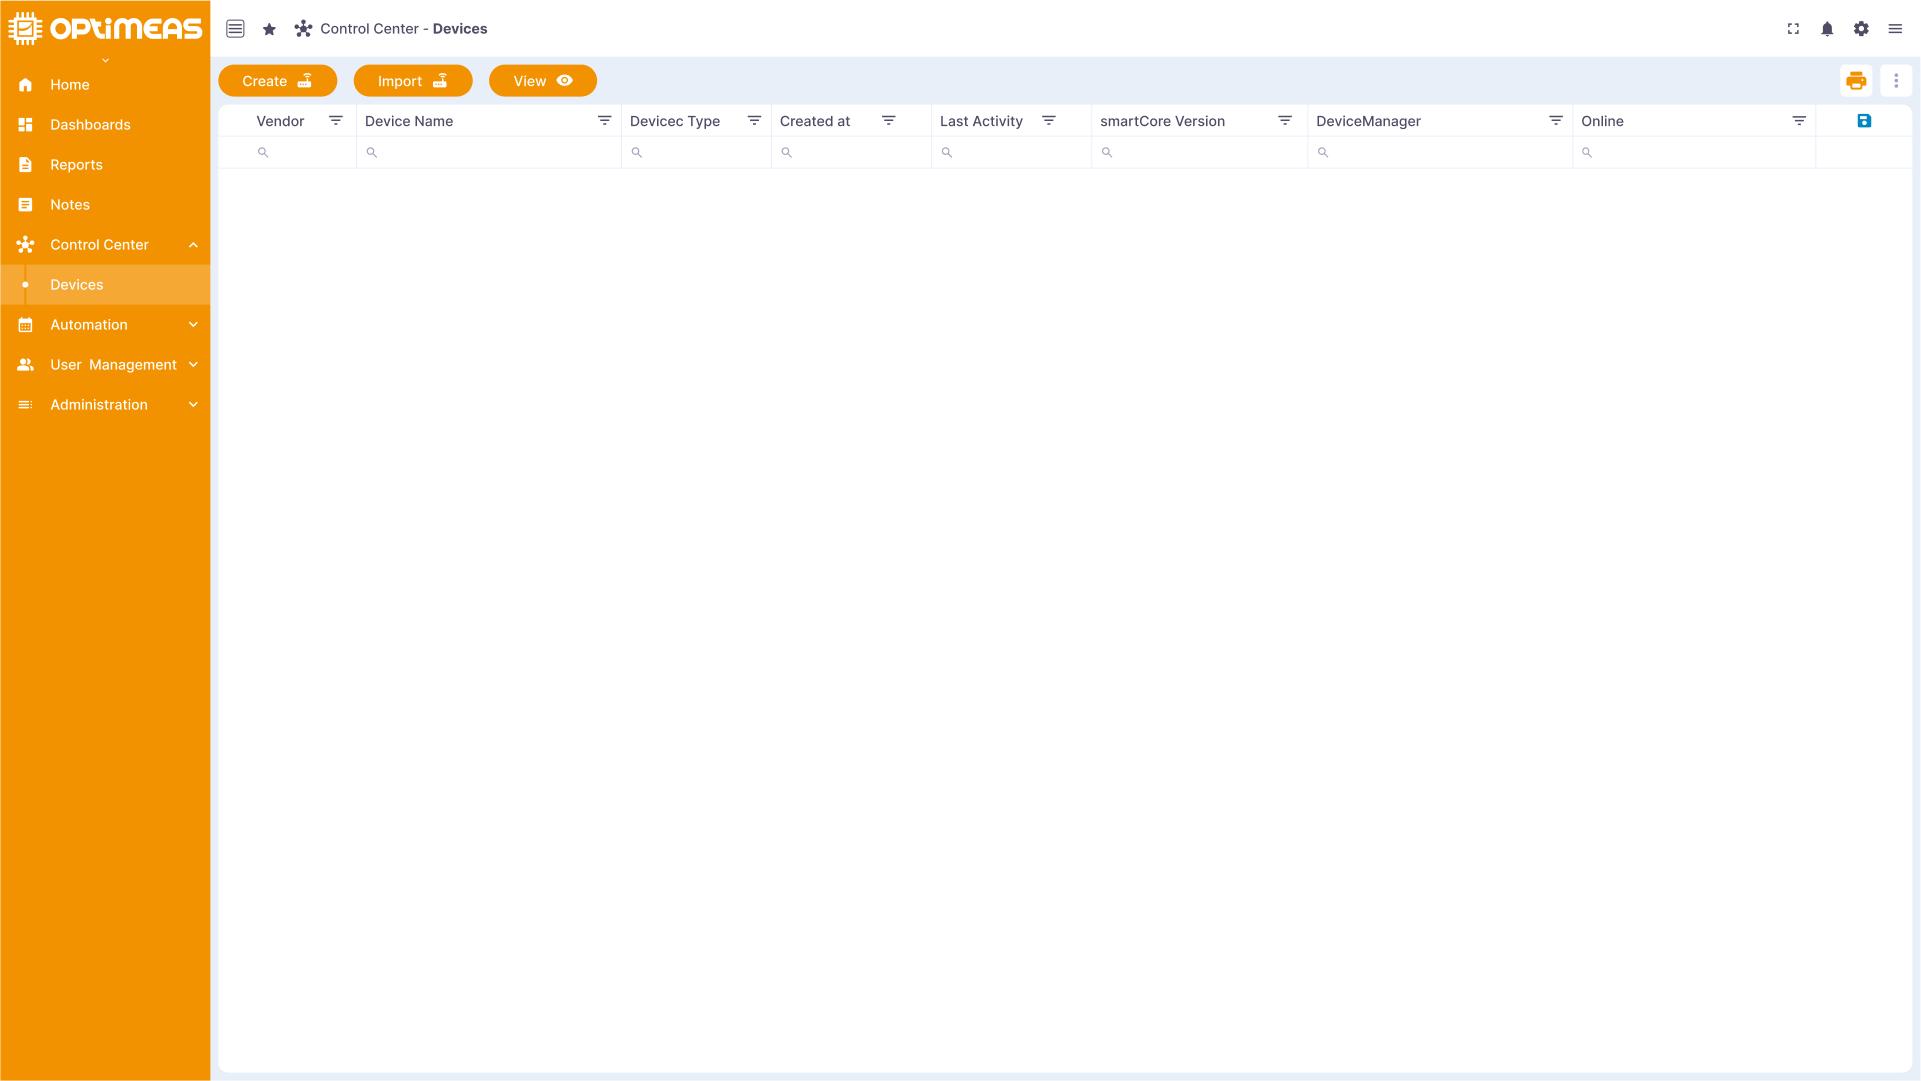
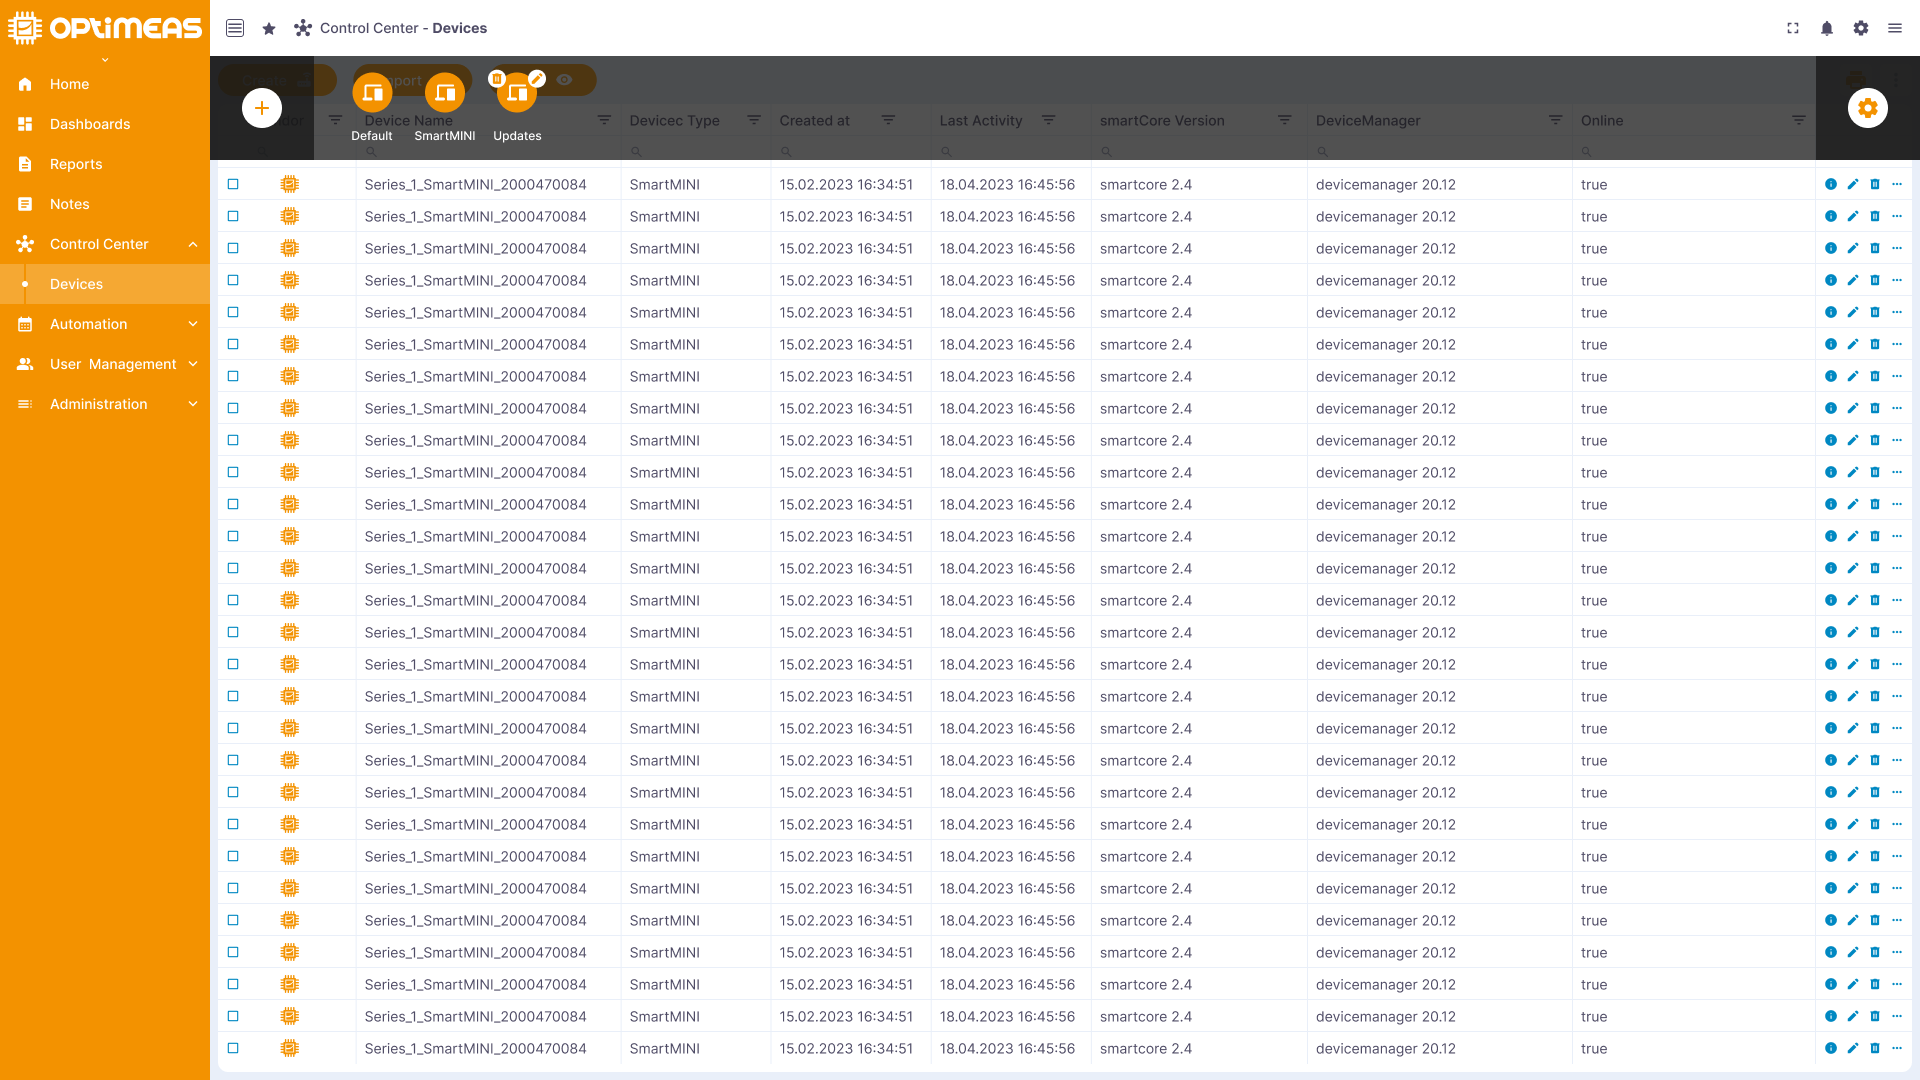
Connect your device
Navigate to the Control Center -> Devices area. There are no registered devices in the overview. To add your first device, click on the "create" button in the top left-hand corner of the page and add a new device. As you will notice over time, the upper area directly below the header bar is the action area, where the respective actions are located depending on the page.
Fill in the form that now appears accordingly, whereby it is completely up to you which name, which type and which label you give your device. These designations can be used for further functions, but they are not of interest for this tutorial.
Now add the device by completing the individual steps of the form. In the last step, you will receive a summary of your entries and can then confirm them.
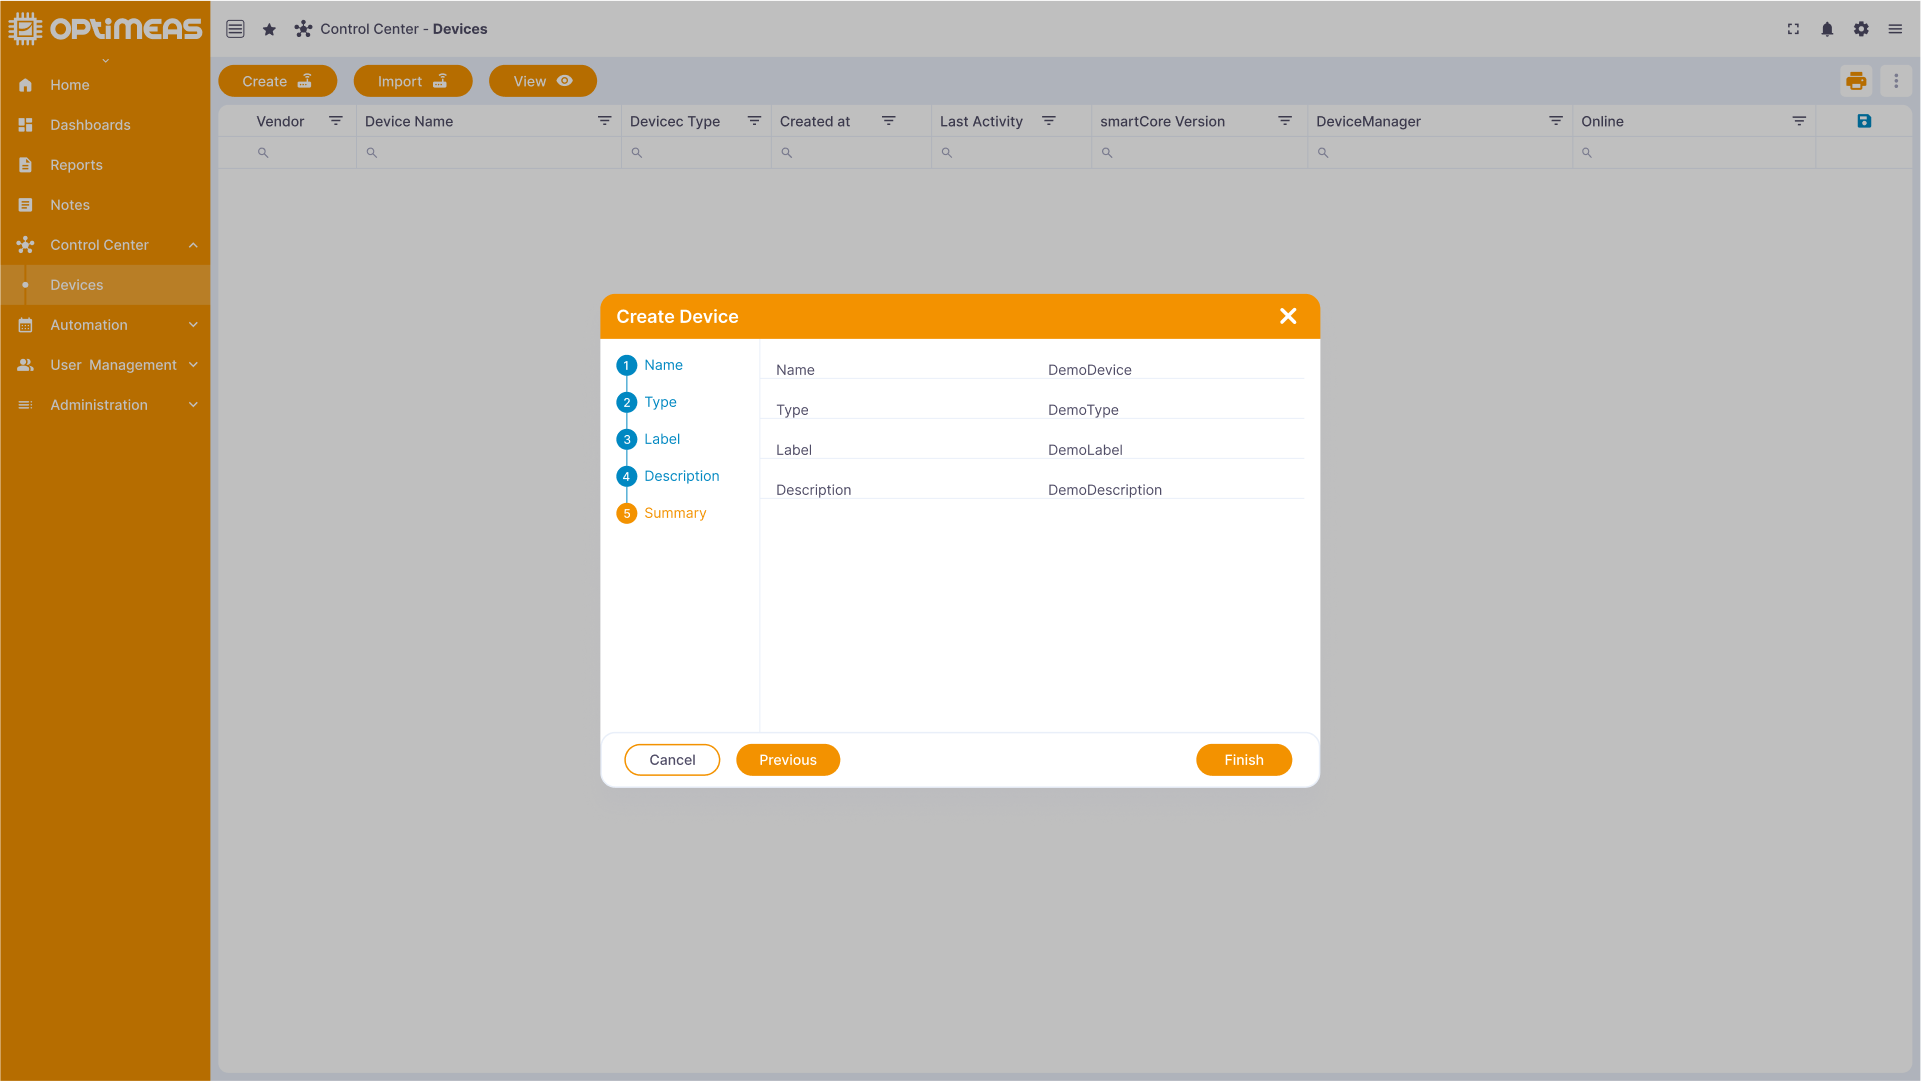
You have now successfully created your first device. The best thing to do first is to take a look around to see what there is to discover and adjust in the devices. To do this, simply click on the info icon in the right-hand action area of the table, which will open the detailed view. You can view the various functions of a device under the different menu items in the detailed view. Of course, everything is still empty, as no real device from the real world is yet connected to this digital twin, but you can already guess what is hidden behind the Storage, Telemetry, Attributes, Notifications etc. areas, for example.
Login information
Now open the Security menu item in the details area. Here you can view the ID of the device used on the cloud side and the access token, make the device public and delete the device. While the device ID is fixed and is generated by the cloud itself, the access token is a freely selectable token that is used to authenticate the device. So if a device from the real world sends data to optiCLOUD, it must authenticate itself with this device token in order to be authorized for data transfer.
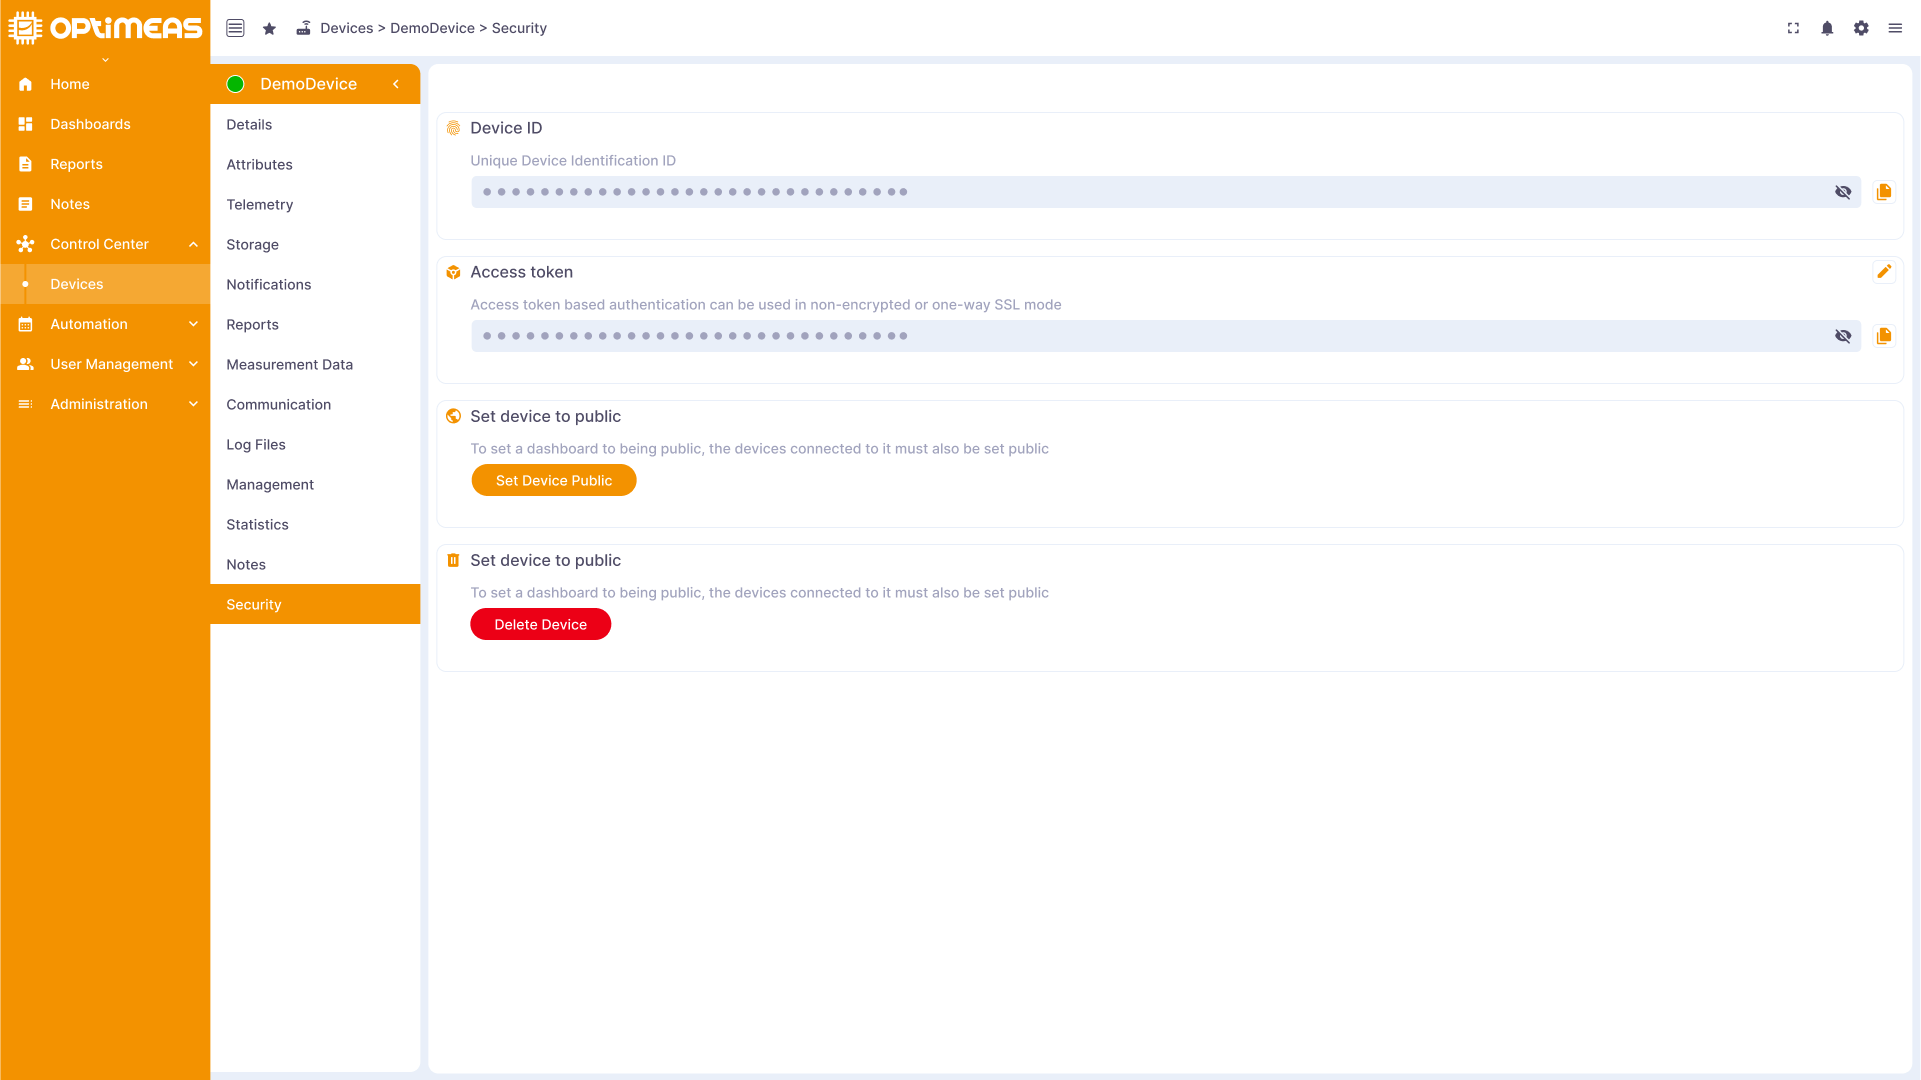
Please copy the device token using the button provided. It is required for the connection and must be entered in the device.
Configure SmartMINI
Now switch to your PC and open optiCONTROL. You should already have the user manual for optiCONTROL. This will tell you how to connect a SmartMINI to the PC and configure it in optiCONTROL.
For the cloud connection via HTTPS, enter the URL of the server under the Cloud tab in the Settings area, as well as the time interval at which the device should report to the cloud at regular intervals and the Access token you have just copied.
Now add the smartCORE module optiCLOUD to the smartCORE configuration and enter the URL of the server in the appropriate place:
    {
      "module": "Opticloud",
      "factory": "opticloud",
      "config":{
        "channels":[
          {
            "name": "*"
          }
        ]
      }
      "brokerAddress": "ssl://URL:8883",
      "brokerUserId": "",
      "brokerUserPassword": "",
      "brokerAuthentication": true,
    }
Important: The URL for communication via MQTT is as follows: ssl://URL:8883
- SSL:// is used for the encrypted transmission of MQTT
- 8883 is the port via which optiCLOUD receives the MQTT data
Now enter the token that you copied into optiCLOUD earlier in the brokerUserPassword field.
After optiCONTROL has accepted the data, your device now sends data to optiCLOUD.
Display data in the web interface
As soon as you have set up the SmartMINI via optiCONTROL and it sends the first data, you can view this directly in the web interface. To do this, first navigate back to the Devices menu item, click on the device you have set up and then on the Telemetry menu item:
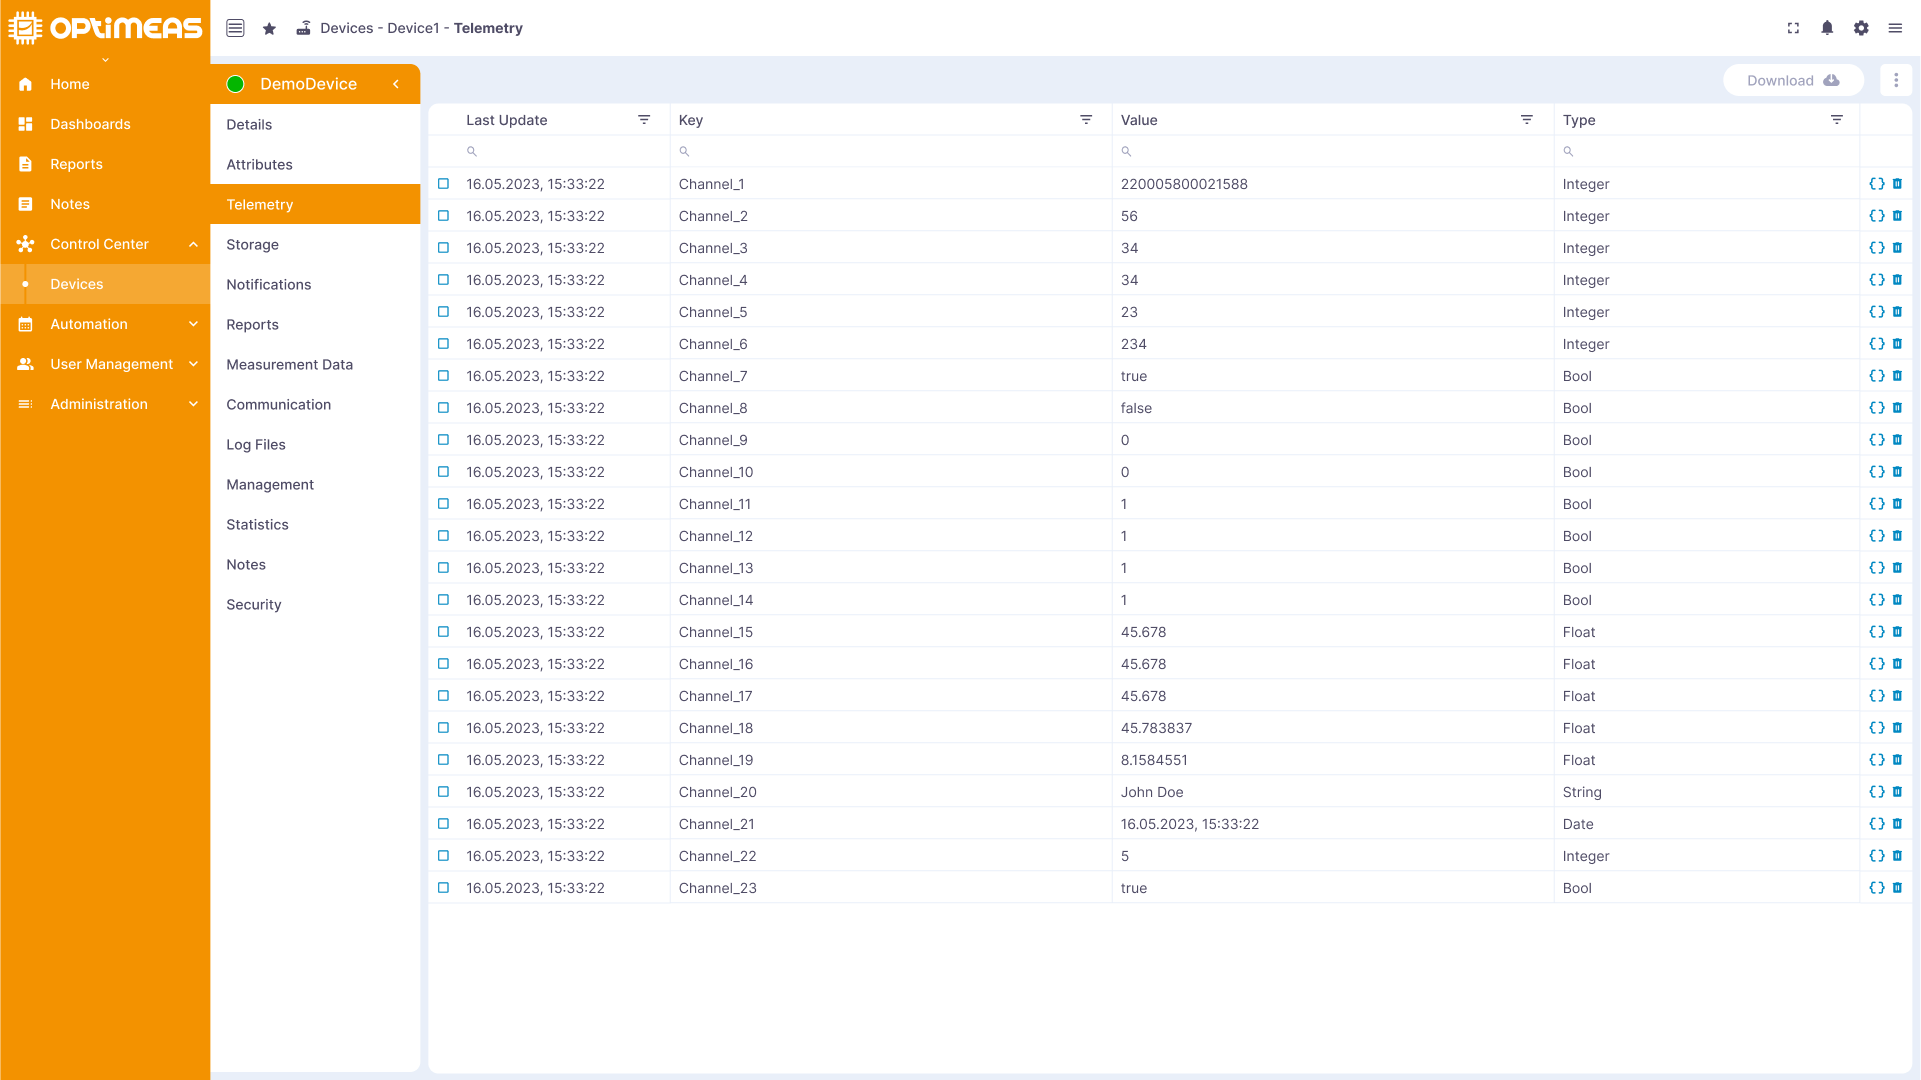
As you can see, our SmartMINI already sends its data to the cloud if it is configured accordingly.
Creation of a view
As this currently open display of the incoming data is only related to a single device and all available data is displayed, you can already imagine that this is not the best way to view the incoming data for a large number of devices. Our so-called Views provide a remedy here. Navigate back to the device overview table and click on the Views action button. An additional header will appear showing you the current view, as well as the option to create a new view on the left-hand side and the option to manage existing views on the right-hand side.
Now click on the add icon to create your first view. A new configuration page opens where you can create your own view.
The aim of a view is to conveniently display all the data required for everyday work at a glance. As you have to perform various tasks in connection with your devices throughout the day, you can also create different views that are tailored to the respective task. Especially when it comes to monitoring or managing one or more fleets of devices, it is highly advisable to set up different views for easy monitoring and management of the connected devices.
For example, you can imagine the following view:
- Temperature Monitoring
- Activity monitoring
- Firmware/software updates
- etc.
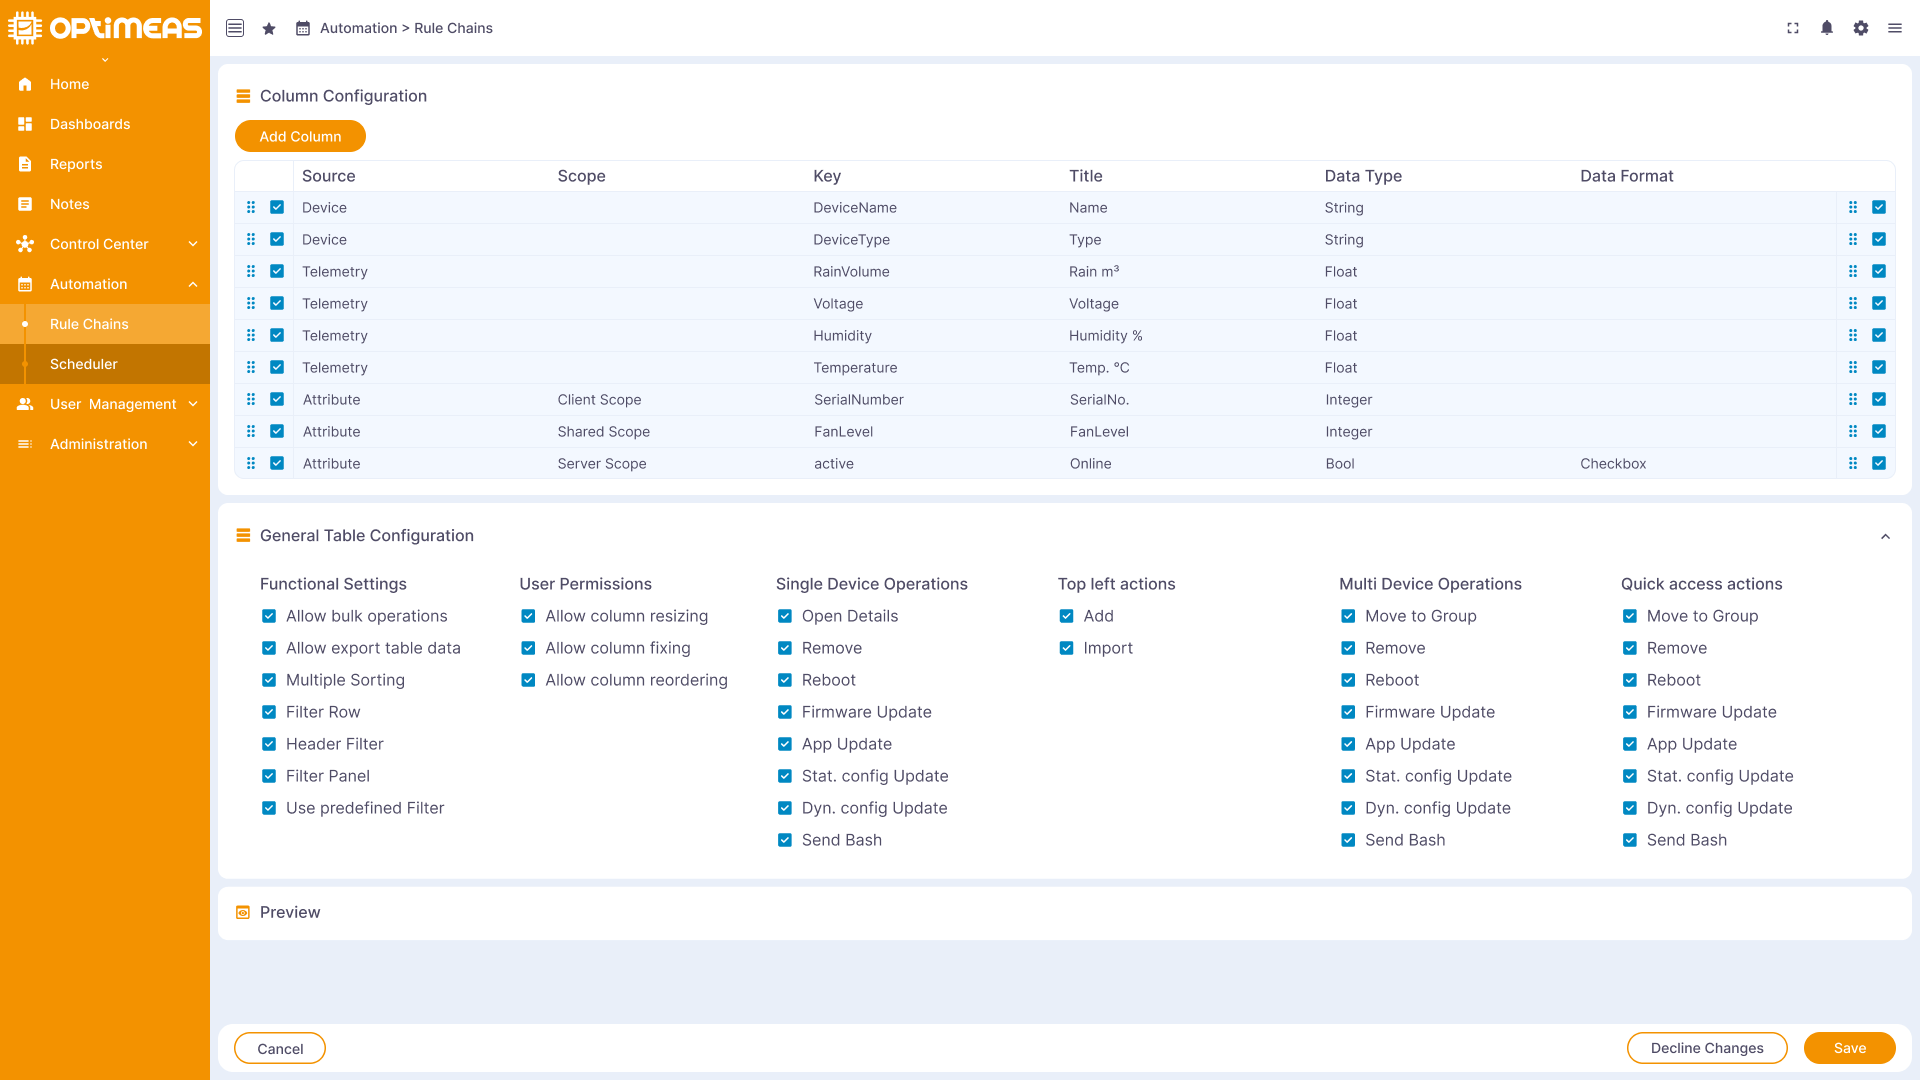
Each of the views created can therefore display the data required for the respective task across all devices in the fastest possible way. The need to click through the individual devices and repeatedly perform the same actions in order to observe certain values is now a thing of the past. Once a view has been created, all the required information can be viewed with a single click.
To customize the view according to your own ideas, you simply have to select the corresponding values that you want to see in your view in the upper column configuration. To do this, click on the Add Column button and fill out the form that pops up. In the general table configuration area, you can also specify which actions should be available to the user within the view.
Visualization of the data
Up to this point, we have only been able to view our data in tabular form and without a history. Another way to view the data in a different form and also historically are the so-called dashboards. These are completely freely configurable views using widgets, on which you can view your data in charts, tables, gauges and much more.
To create such a dashboard, please first navigate to the Dashboards menu item in the left-hand menu bar.
As no dashboards have been created yet, this area is currently empty. Over time, however, it will fill up quickly and allow the visualization of a wide range of data in a variety of ways.
First click on the Create button again to create a new dashboard. A forum opens again, in which you can give the dashboard a name and a description.
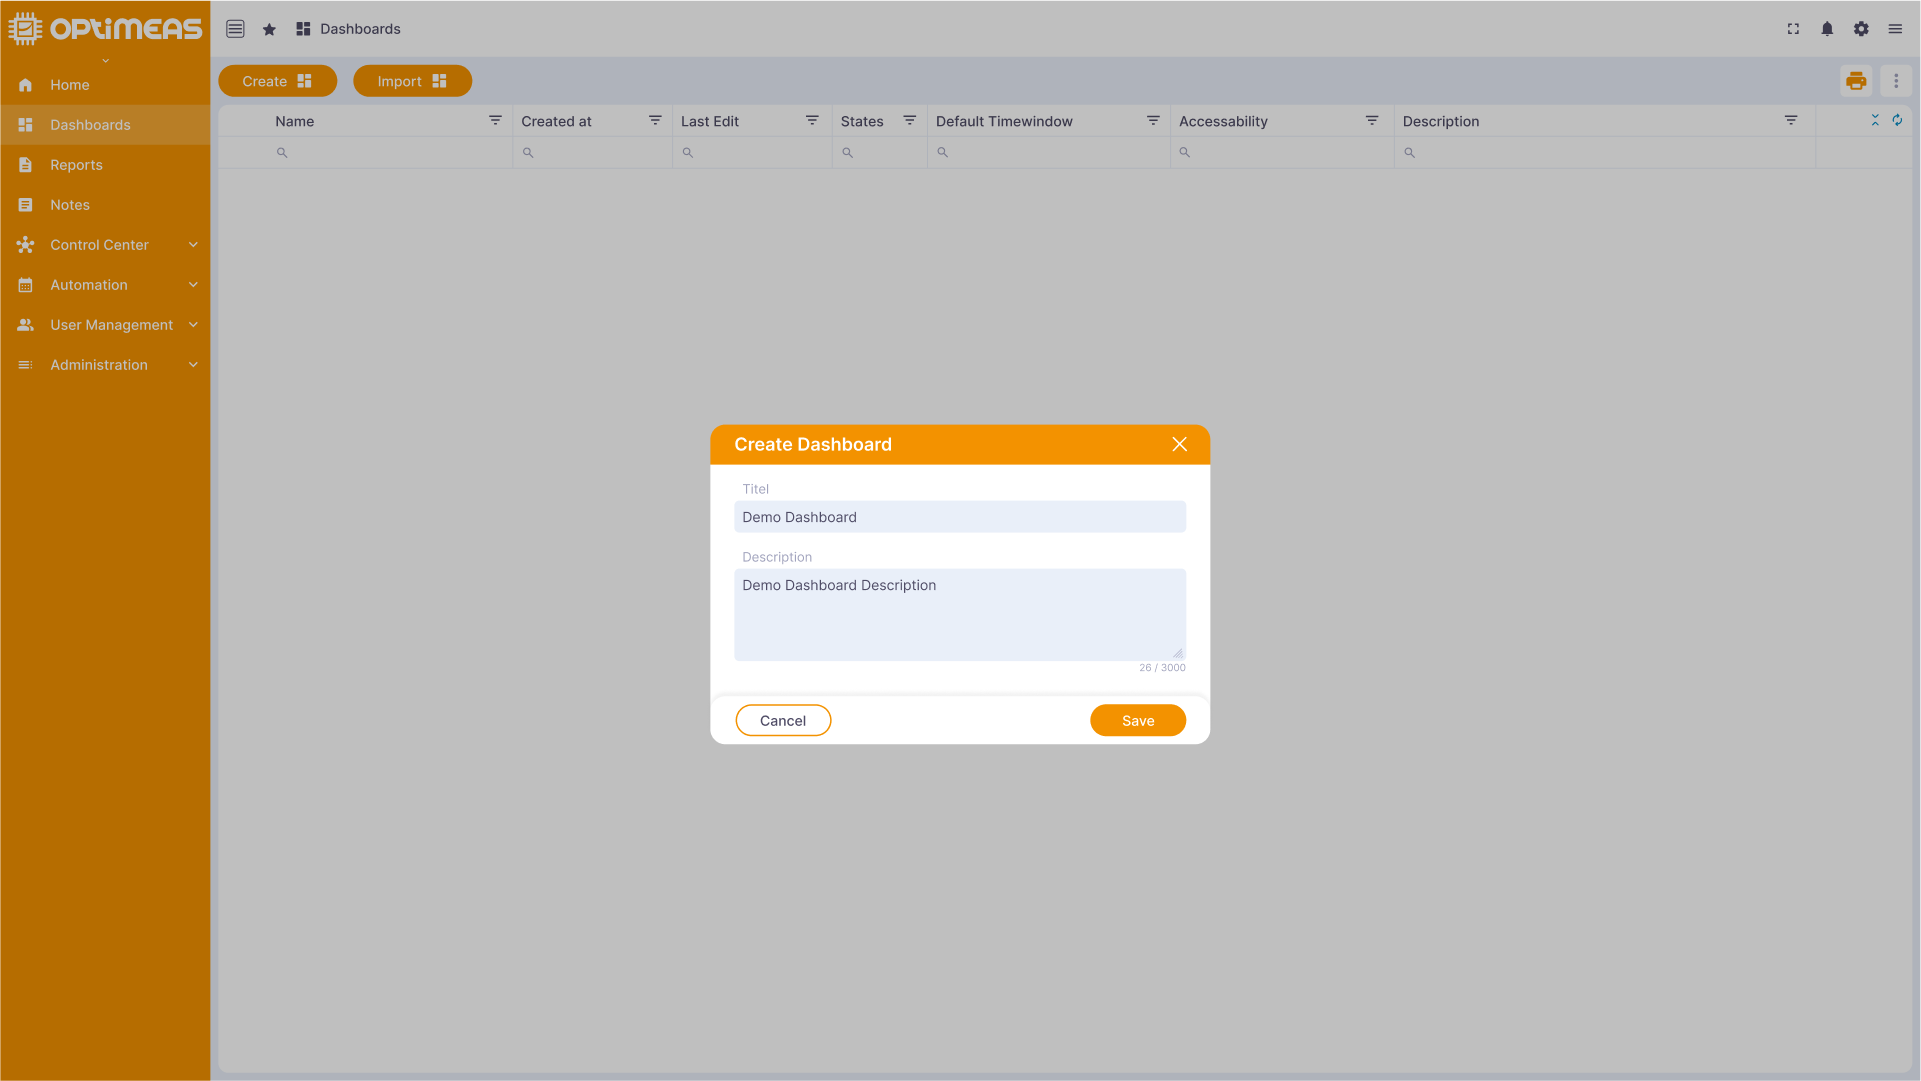
The name of the dashboard is up to you and, unlike devices, it does not have to be unique.
Once the dashboard has been created, click on the Open in edit mode icon in the right-hand action column of the table to open the dashboard directly in its edit mode.
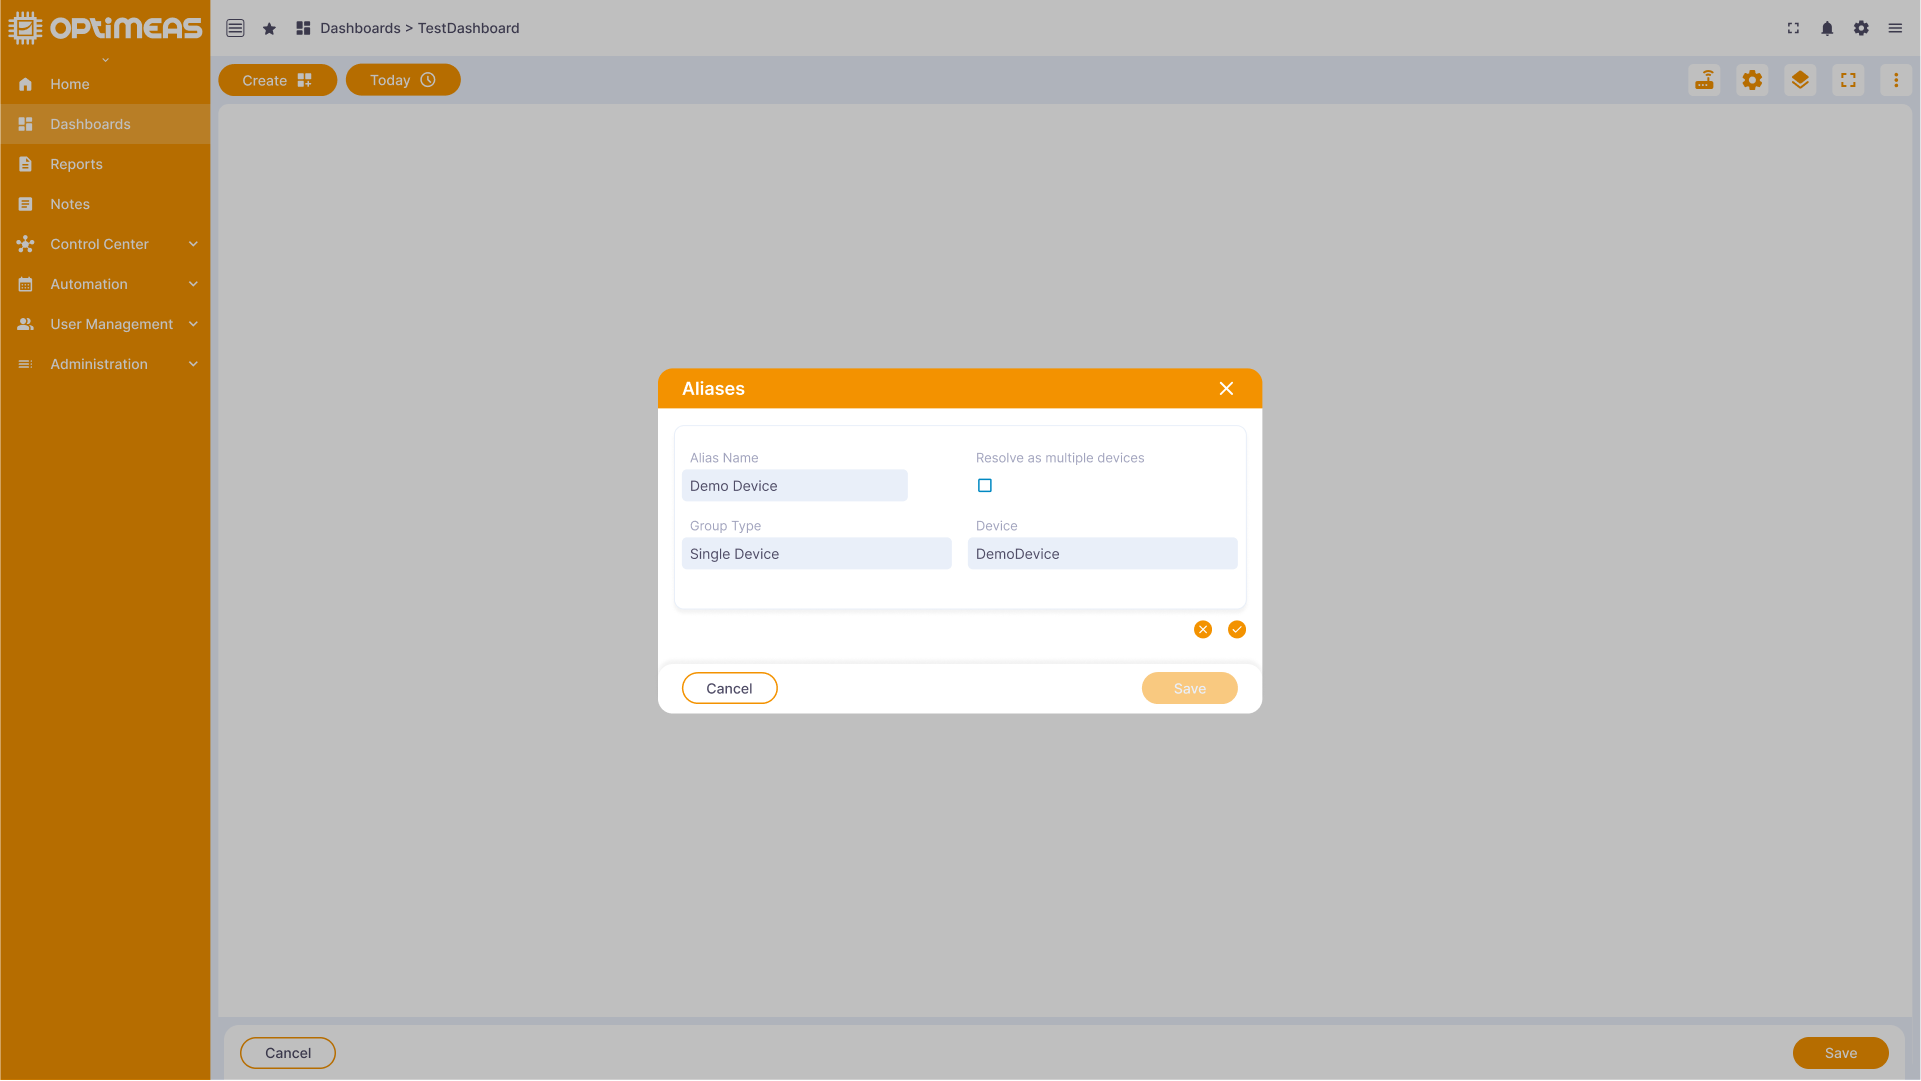
As a dashboard is initially an empty shell that is waiting to be filled with data and other connections, you will see nothing but an empty page in the first view. To change this, first click on the Alias button in the top right-hand corner. An Alias is a synonym for the device or generally the devices that our dashboard represents. This may not seem intuitive for a single device, but for the visualization of data of entire fleets or similar, a separate alias is advantageous for the overview and setting of the visualization.
In the window that now opens, click on Add alias and give your device an alias name. Under Group Type select Single Device and then under Devices select the Device you have created. By clicking on the icon with the checkmark, the alias is created, which is now a synonym for the device you have just created within this dashboard.
Whenever the alias that has just been created is used within this dashboard, the application knows that it is the device that has just been created.
As I said, this does not seem particularly intuitive at first glance and for a single device. But imagine for a moment that you have a fleet of 50 devices and want to view a temperature value from all 50 devices as a line chart. You do not want to always have to select all 50 devices when creating each widget (we will come to this directly). You can use the alias to initially create a synonym ("alias") so that the dashboard knows that there are actually 50 devices behind this one alias. This makes setting and configuring the data visualization much easier afterwards, as you only ever have to reference the one alias instead of all 50 devices behind it.
Once the alias has been created, you can now add a first widget to the dashboard. To do this, click on Add widget which opens a new form.
There are different widget packages for different types of visualizations that you can choose from. In this example, we will first select the visualization via a simple chart. To do this, click on Charts and then select the line chart from the Lite of available charts. Confirm your selection with add.
In the window that now appears, we select the data source for the chart by clicking on "Add" under Data sources under Devices as the source and selecting the alias we have just created as the alias.
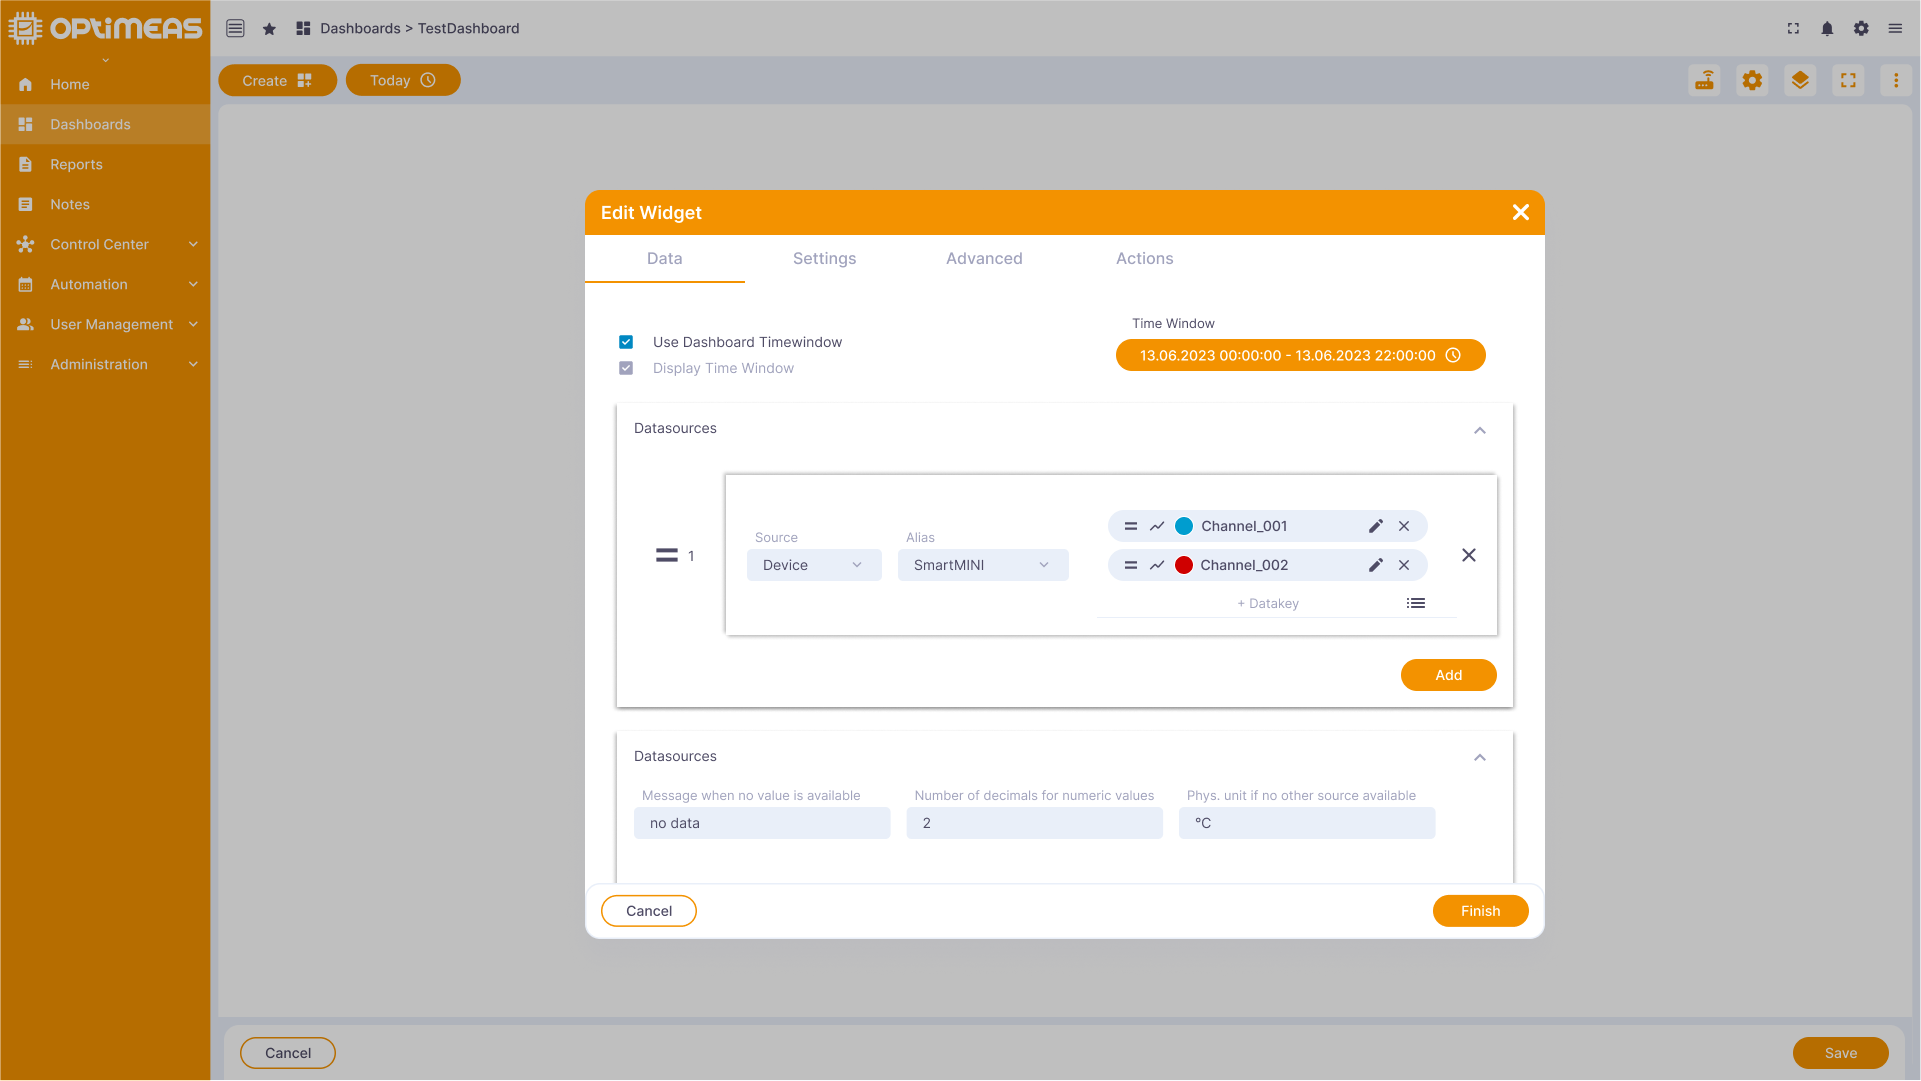
In the selection box on the right-hand side, we can now select the channel or channels to be visualized:
With a click on save the widget is added to the dashboard and we have done it - our first visualization of live data:
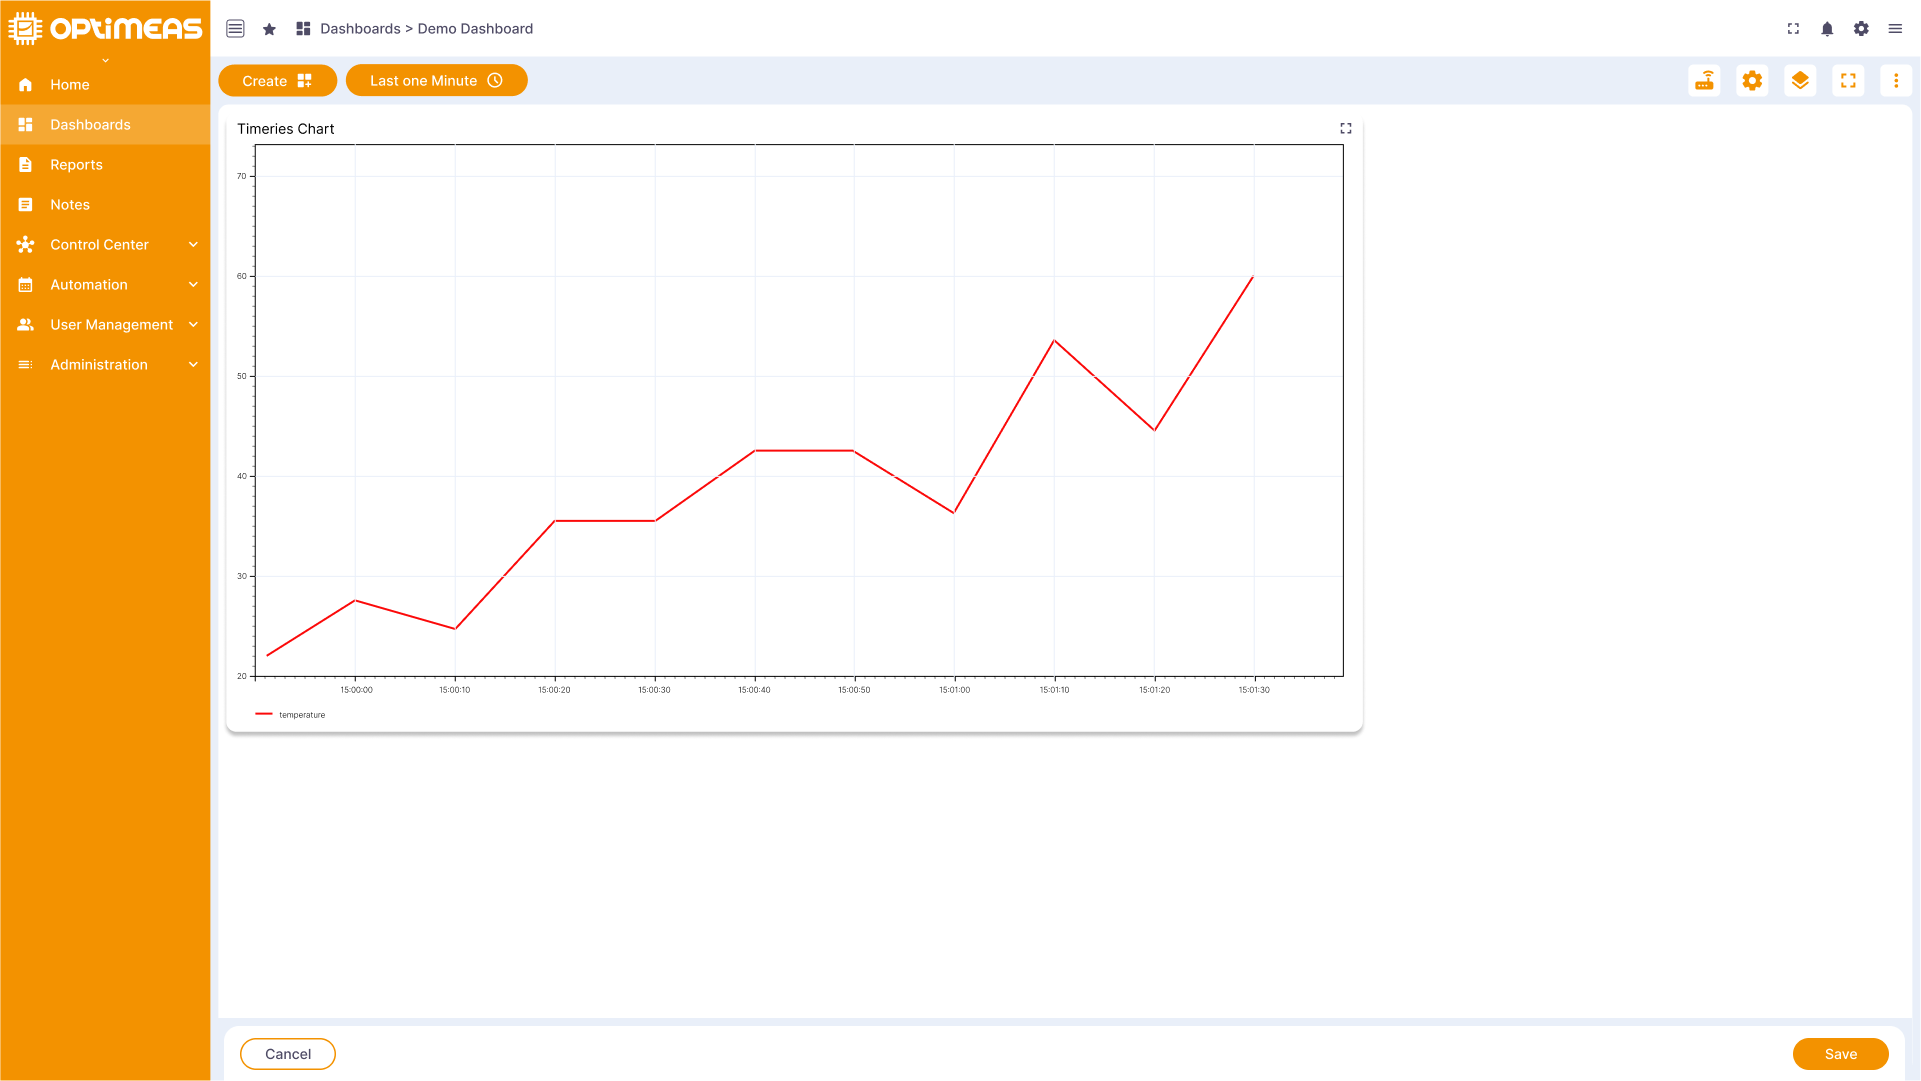
Now that you have successfully created your first device on the cloud, created your first view and visualized the data on a dashboard, it is best to look around a little further in these three areas. There is a wide range of additional functions that you will become familiar with over time and which are described in the individual chapters. More and more functions will be added to the cloud over time, so it is always worth delving into the individual chapters of the documentation. New features are communicated and linked via the Notifications Bar.
Have fun with the further use of optiCLOUD