Overview
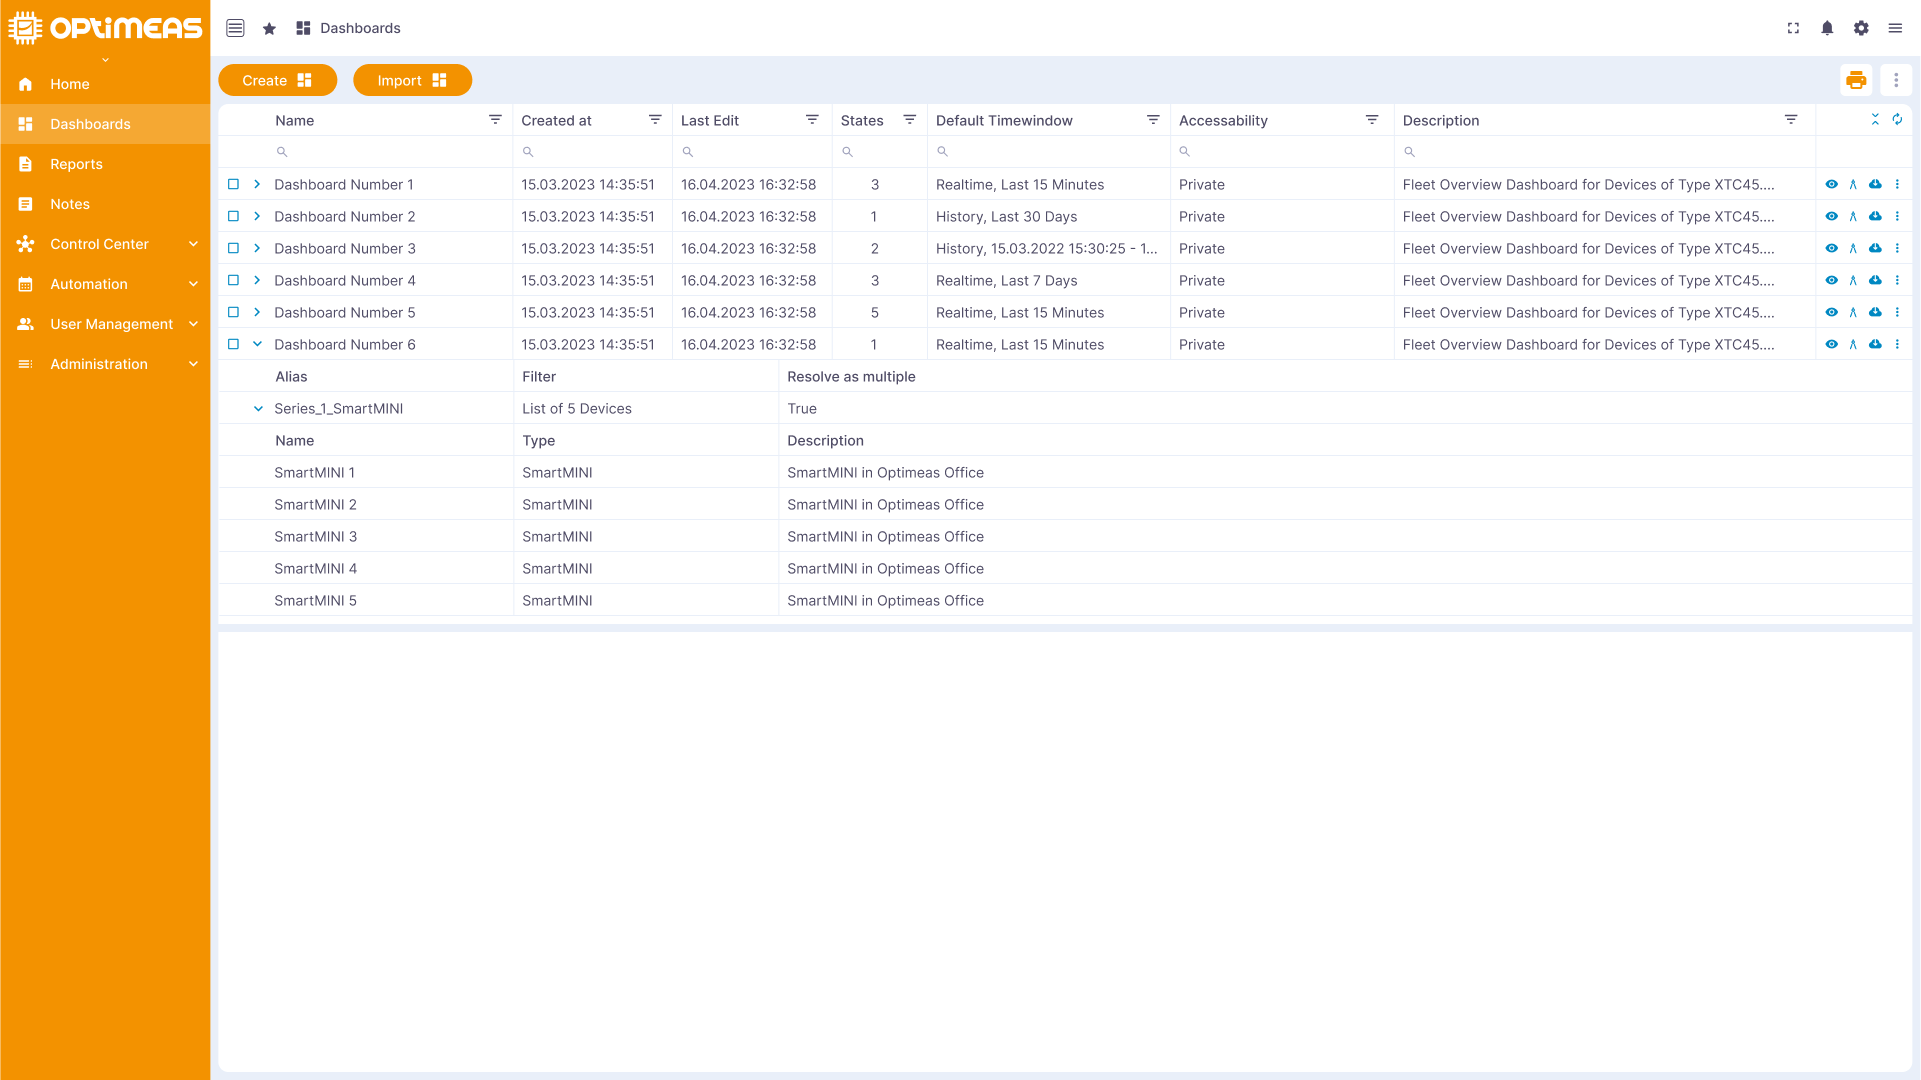
The dashboard overview lists all dashboards within the current project. The table shows the respective name, the creation time, the last editing time, the number of "states", the set time window, the status and a brief description of the contents of the dashboard. If you expand a line in the table, you can see the devices linked to the dashboard.
You can use the edit button on the right-hand side of the table:
- Open the dashboard
- Open the dashboard directly in edit mode
- Export the dashboard
- Edit the basic information (title, description) of the dashboard
You can use the buttons at the top left of the page to
- Create a new dashboard
- directly import dashboards already stored locally on the PC
You can use the batch operations at the top right of the page:
- Export the selected dashboards directly
- Export the current table directly to Excel using the print button in the top right-hand corner
- Delete the selected dashboards