Digital twin
The device is the core of your IoT project in optiCLOUD. It represents the digital twin of your real application and contains all the associated data. As an asset in the real world can only be precisely described by a set of different data, the device in the cloud as a digital twin also has a variety of different data types that can be filled. These different sub-areas and their underlying functions and properties are described below:
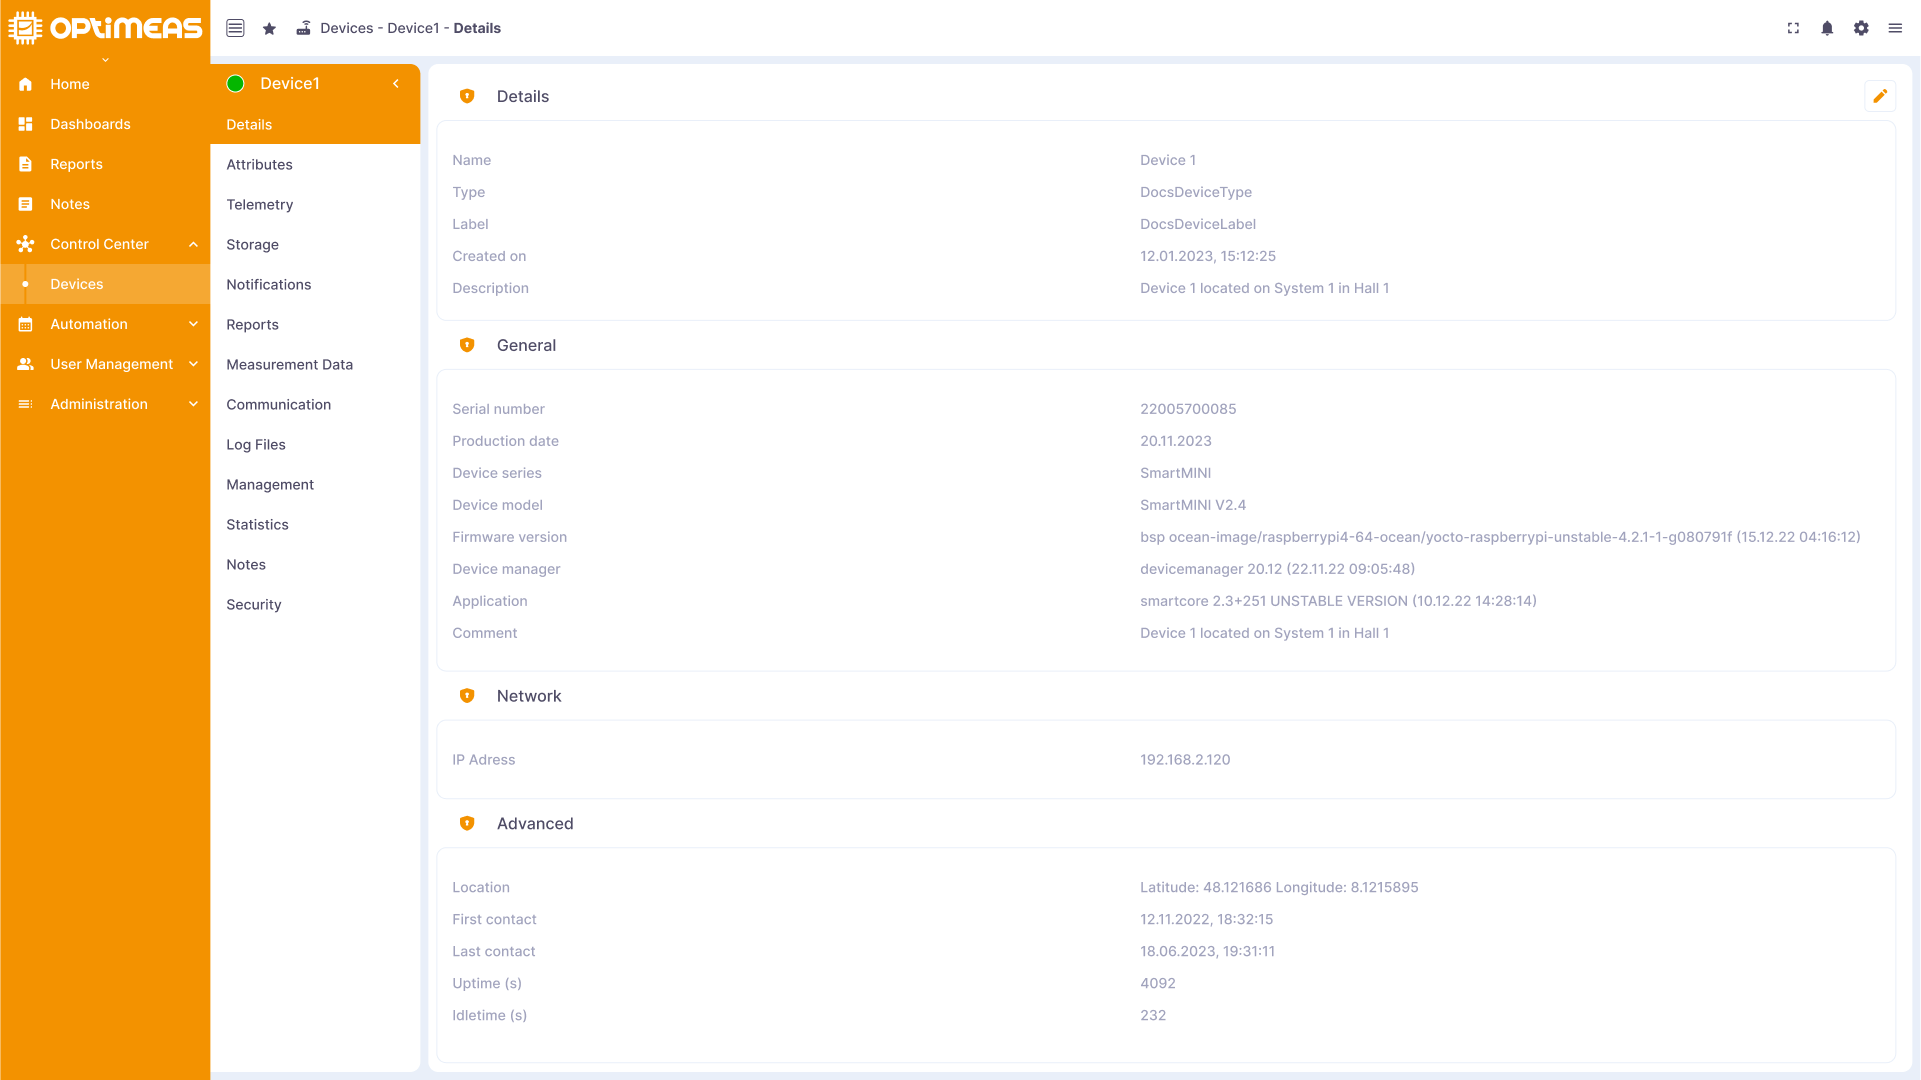
Details
This section contains detailed information about your device:
- Name
- The name of the device that the user gave it when it was created in the cloud
- Device type
- The type of device that the user assigned to it when it was created in the cloud
- Label
- The optional label of the device that the user added to it when it was created in the cloud
- Description
- The optional description of the device that the user gave it when creating it in the cloud
- Creation time
- The time at which the device was created in the cloud
Attributes
The various attributes of the device are listed here, which have been created for a device and can describe its functionality and features, or which the device itself sends directly to optiCLOUD. In contrast to telemetry data, no history is created for attributes, only a current valid value is saved. In the case of attributes, it is therefore not possible to see what the value of the attribute was at time X in the past, but only what its current value is.
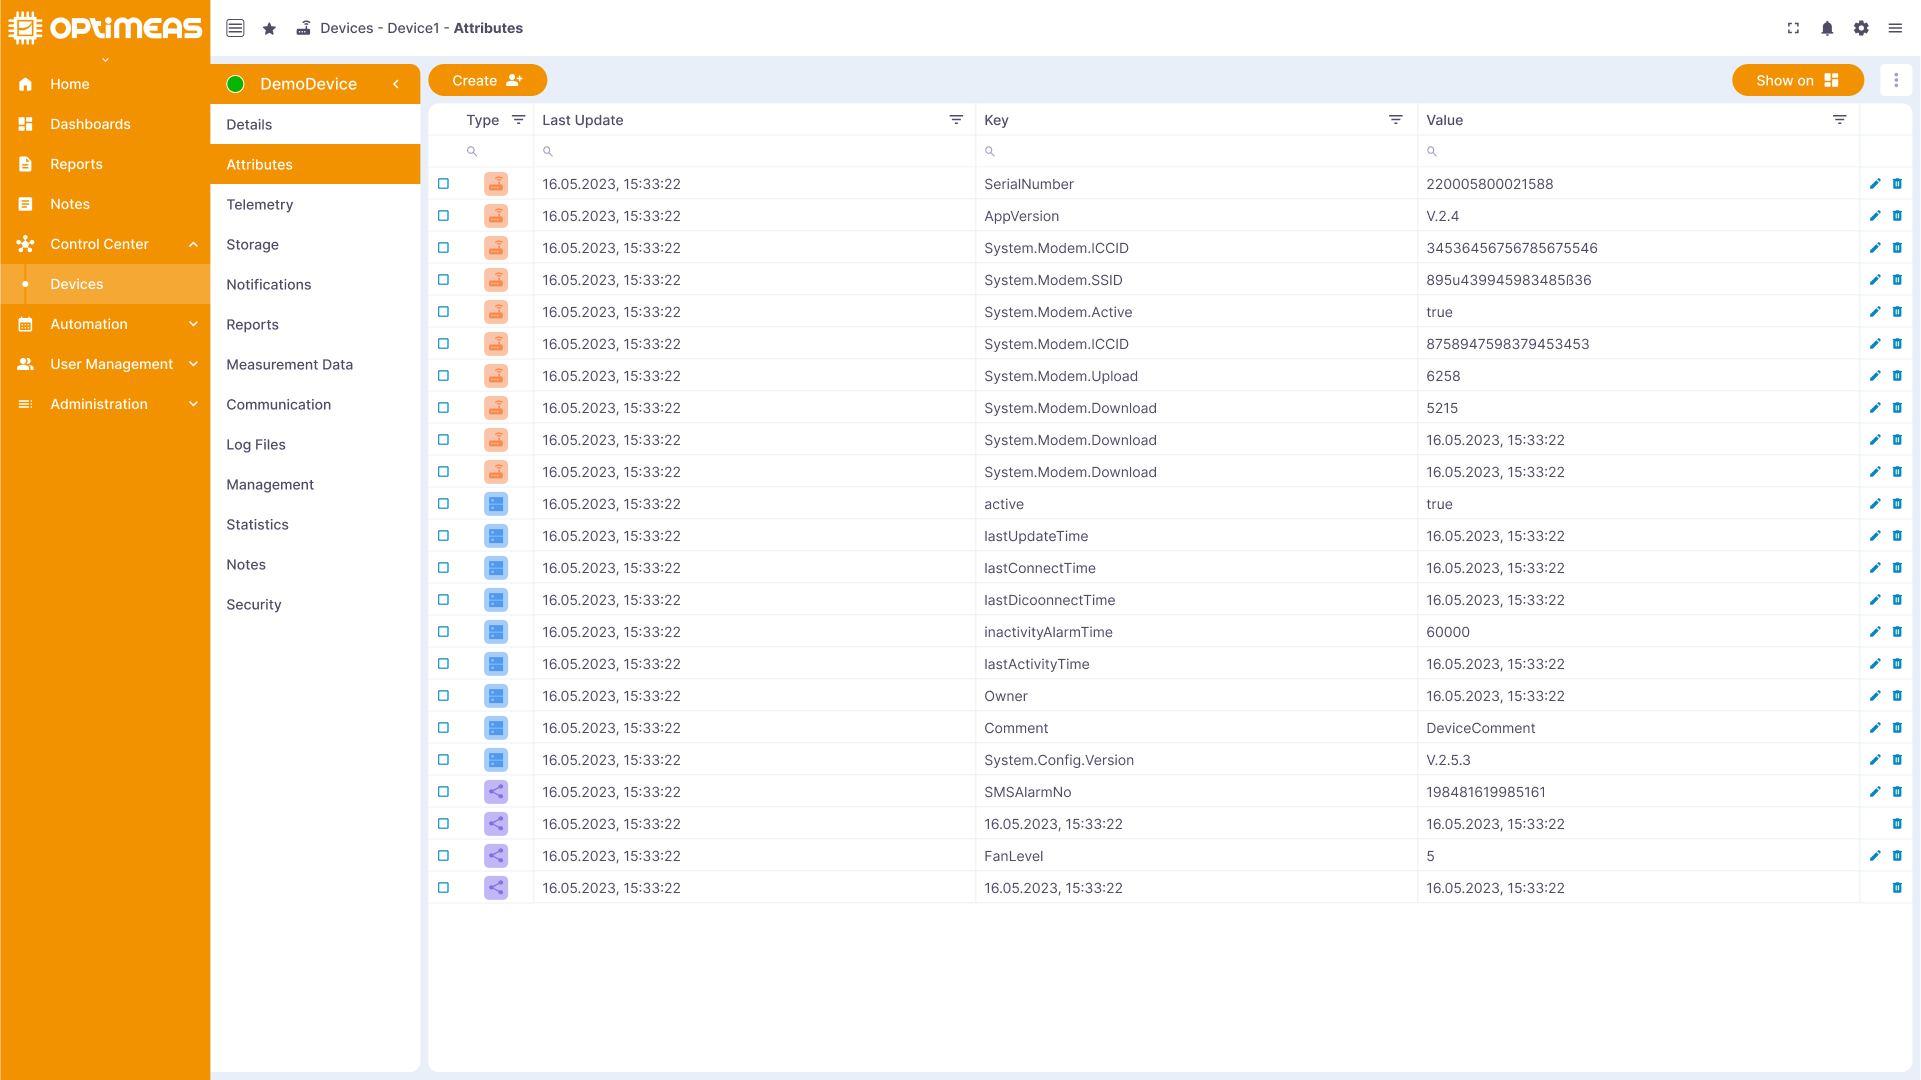
Attributes are divided into different types, which differ in terms of who can set or read them:
- Client attributes
- Client attributes originate from the device itself. The device (the client) can create them and set the value. The user can only read the value, but cannot create client attributes themselves or change their value. A typical example of this would be the serial number of a device.
- Shared attributes
- Shared attributes can be created and changed by the user. The device cannot change the value of shared attributes, but can read their value. The device can therefore be informed about changes to the value via the "subscribe" function (see MQTT) on an attribute. This can be used, for example, to "remotely control" a device by integrating shared attributes into functions of the device and then controlling these functions from optiCLOUD by changing the attribute.
- A typical case of this would be, for example, the setting of a gradually adjustable air conditioning system, whose current power level can then be controlled remotely via a shared attribute.
- Server attributes
- Server attributes can be added to a device by the user and their value can be changed. In this case, the device itself has no possibility to set these attributes or even to change their value. They are therefore purely attributes located within optiCLOUD for a device.
- A typical case of this would be, for example, the assignment of a device to an optiCLOUD user, which may change regularly.
The button for creating new attributes + is located on the left-hand side of the button bar. Clicking on this opens the corresponding wizard, which guides you through the creation of an attribute.
On the right-hand side are the buttons for the batch operations, which become active when multiple attributes are selected via the checkboxes on the left-hand side of the table. ☑
The "Show on widget" button can be used to create a dashboard directly from this area of the device, the alias of which is automatically linked to this device.
The 🖶 button can be used to export the table currently displayed, or a multiple selection of these, directly to Excel.
The ⠇ button can be used to delete the selected attributes (depending on the type) for multiple selections.
The current attributes and their current value are displayed in the table. The table consists of the following columns:
| Name | Description |
|---|---|
| Type | Attribute type Client/Shared/Server |
| Last update time | Timestamp of last update |
| Key | Name of the attribute |
| Value | Current value of the attribute |
The table header can be used to sort, search and filter as usual.
The ✎ action button on the right-hand side of the table can be used to change the value of the attribute (depending on the type), after which the corresponding wizard for editing an attribute appears.
The delete action button can be used to delete the attribute (depending on the type).
Current telemetry data
This area displays the real-time data sent from the device to monitor its current status.
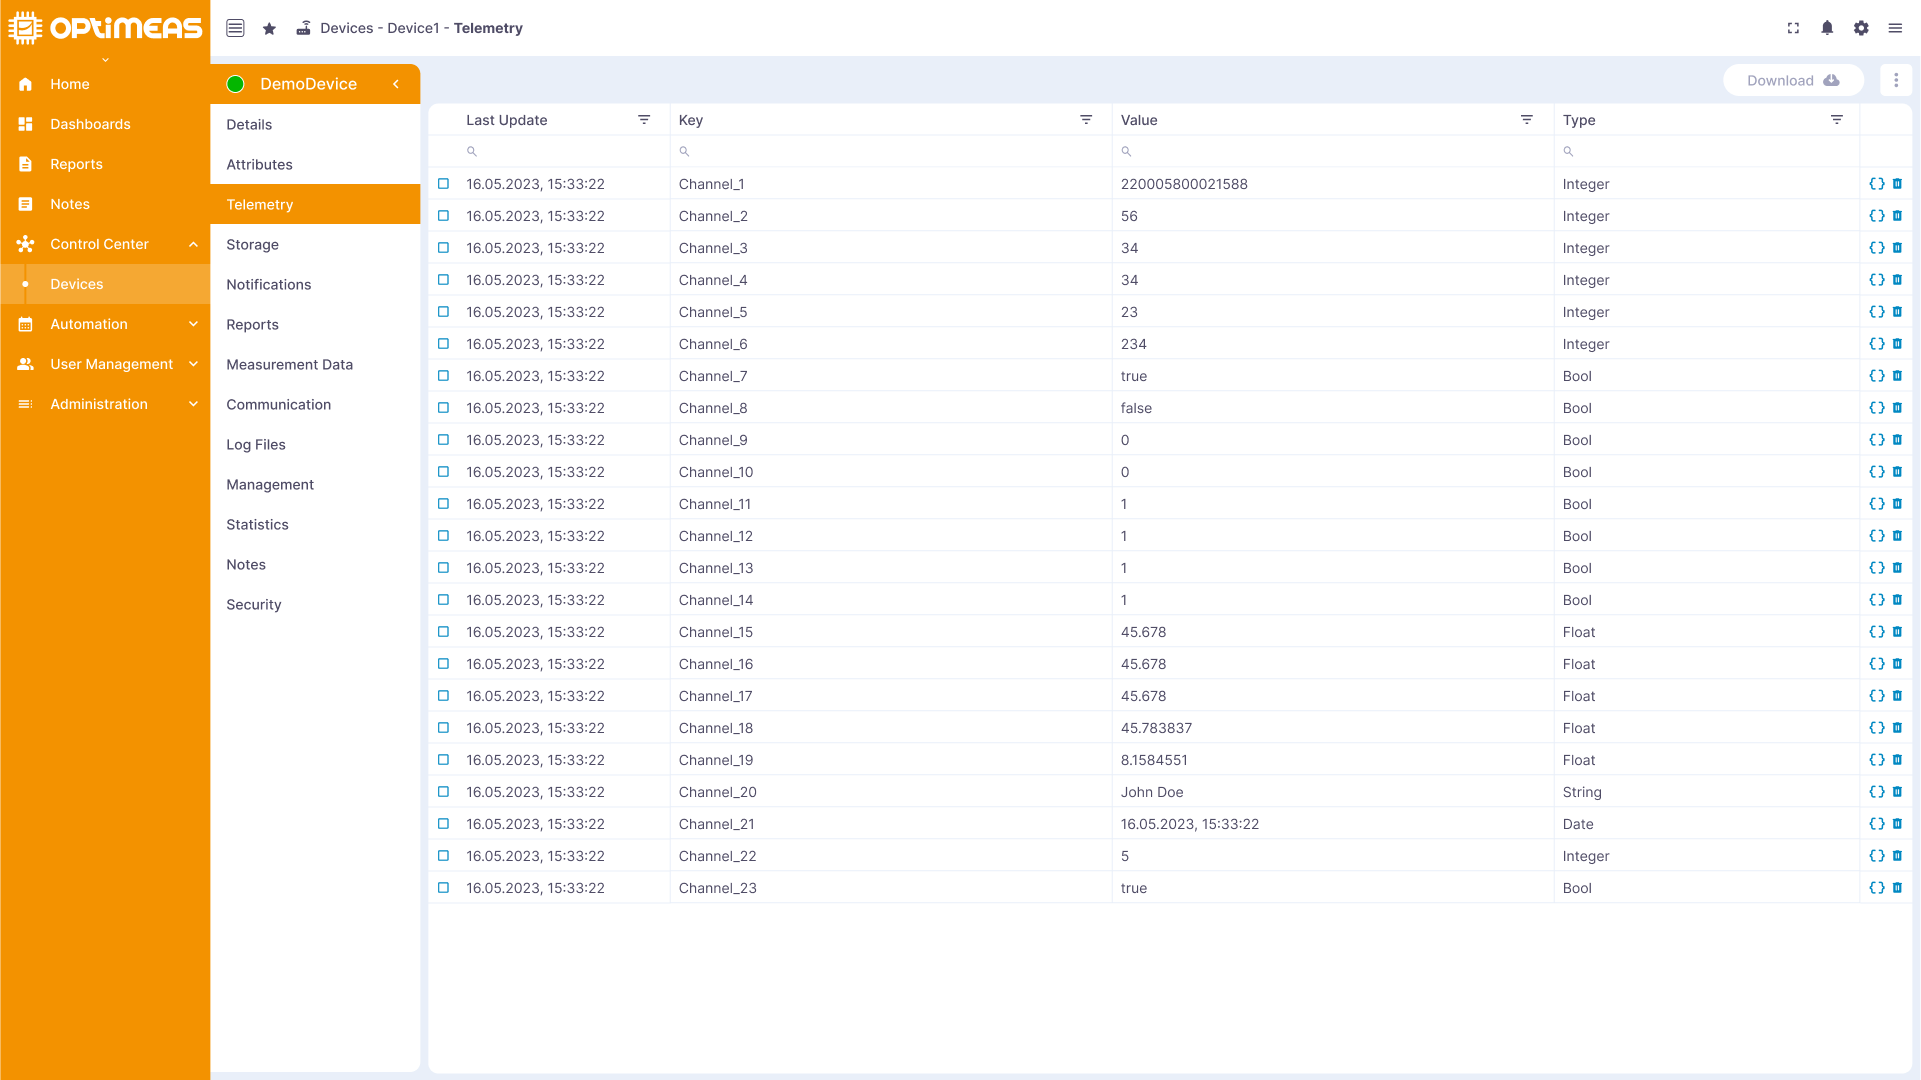
The telemetry data is stored by optiCLOUD as a time series and therefore allows you to look back in time and analyze the development of a measured value over time. The data shown here are those sent by OptiMEAS devices via MQTT and are therefore referred to as live data. The difference between the live data sent via MQTT and the OSF data sent via HTTPS can be read again here.
The buttons for batch operations for multiple selection of telemetry channels via the checkboxes in the table ☑ are located on the right-hand side of the button bar.
The Show on Widget button can be used to transfer the selected channels directly to a dashboard in the event of multiple selection. To do this, click the button to open the wizard set up for this purpose, which guides you through the creation of the dashboard.
The Export button opens the export wizard, in which you can set the period over which you want to export the selected data channels as a .csv file.
The 🖶 Save button can be used to export the currently displayed table or a selection of it directly to Excel.
The ⠇ button can be used to directly delete several telemetry channels selected from the table.
The current telemetry data and its current value are displayed in the table. The table consists of the following columns:
| Name | Description |
|---|---|
| Key | Name of the telemetry channel |
| Last update time | Timestamp of the last update of the telemetry channel |
| Last value | The value that was transmitted at the last update time |
| Type | Data type of the value (Bool/Number/String/Object) |
The table header can be used to sort, search and filter as usual.
The action button on the right-hand side of the table can be used to view the metadata associated with the telemetry channel
The telemetry channel can be deleted using the delete action button
Storage
Files and other data associated with the device, such as configuration files, logs, OSF measurement data, etc., are stored here.
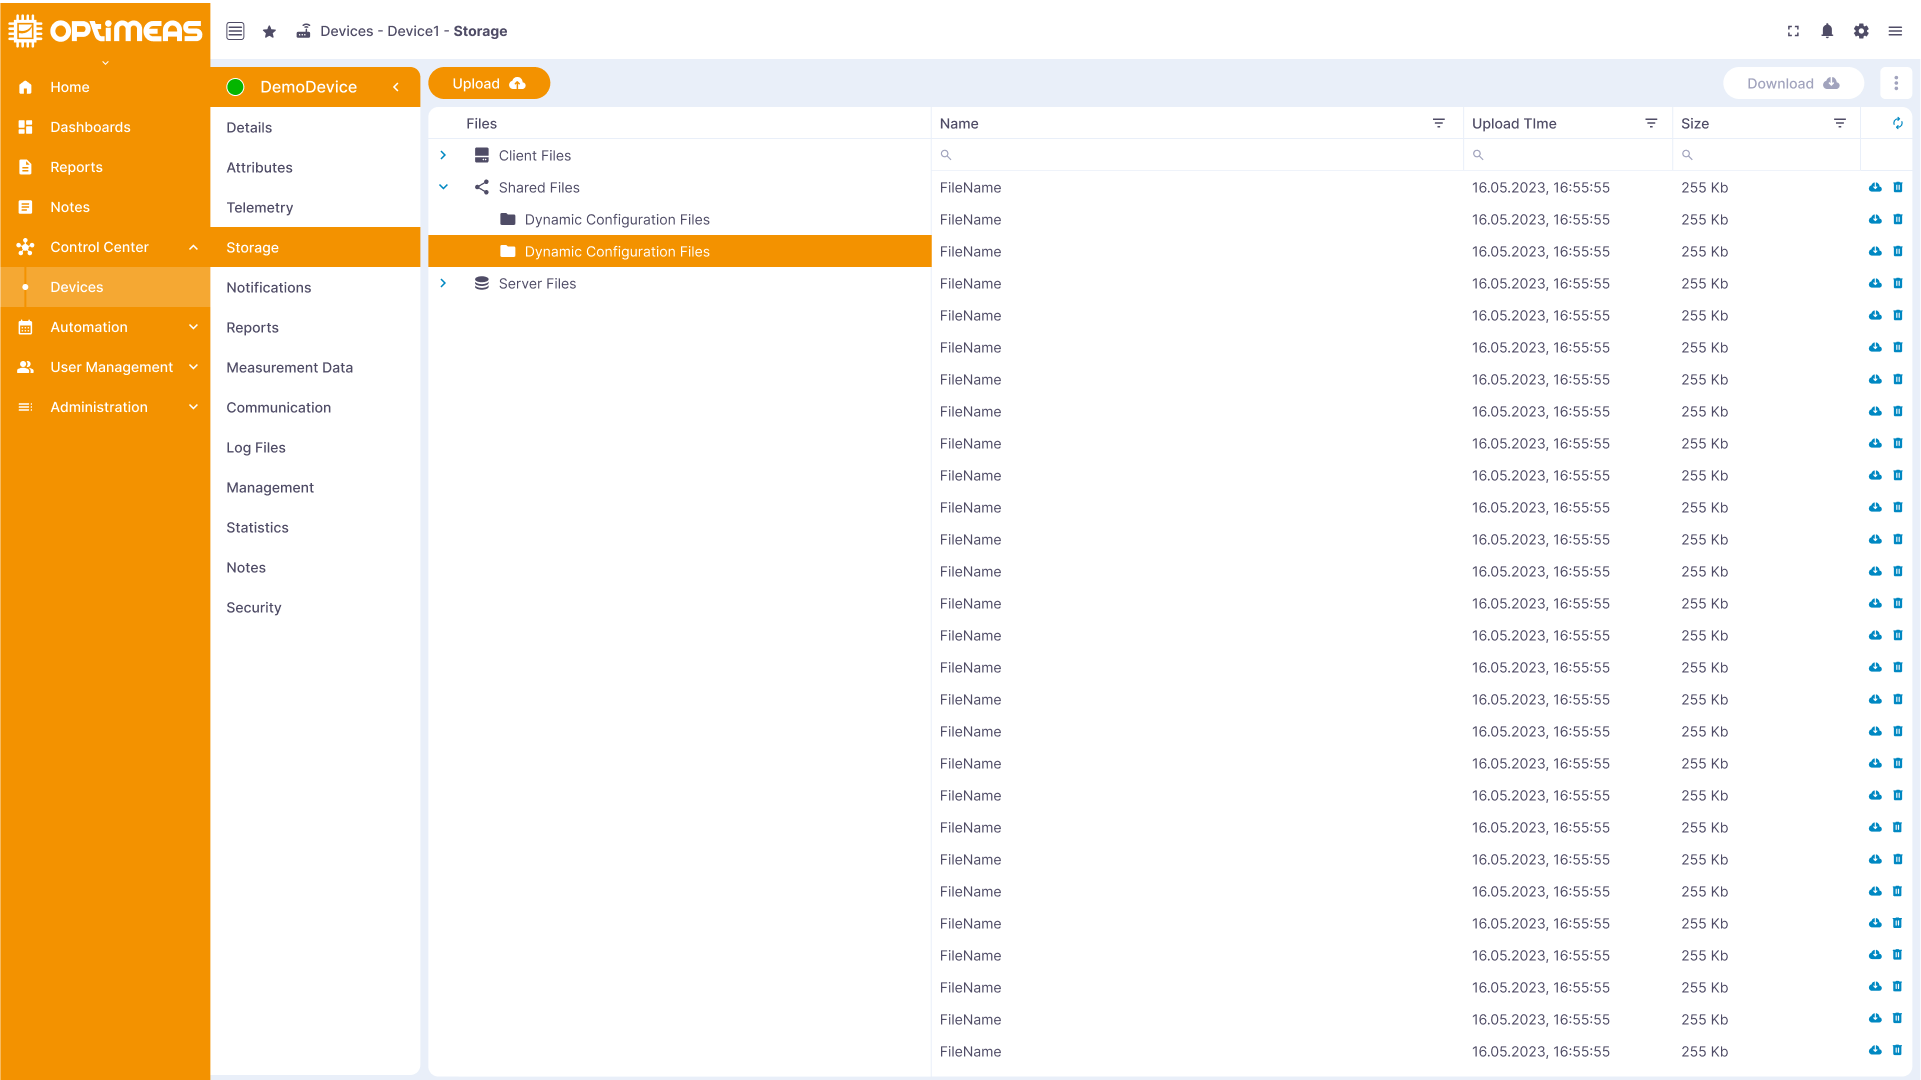
Files are divided into different folders, which differ in terms of who can upload, download, change or delete files in these folders:
- Client files
- Client files originate from the device itself. The device (the client) can upload them. The user can download and delete them, but cannot upload any files to this area themselves. A typical example of this would be the measurement data files of a device.
- Shared files
- Shared files can be uploaded and downloaded by the user. The device can also download them, but does not have the option of uploading files to this area itself.
- A typical example of this would be the update or configuration files for a device.
- Server files
- Server files can be uploaded and downloaded to a device by the user. The device itself has no possibility to download or upload files in this area.
- A typical example of this would be a maintenance log that you want to store for a device.
The page is structured like a file explorer familiar from the everyday PC area, which is structured using familiar folder-file hierarchies.
In the button bar, a new file can be uploaded using the + button on the left-hand side.
Using the batch operations on the right-hand side, the selected files can be downloaded from the Explorer by clicking on the Download button, whereby these are packed in the background into a common .ZIP file, which is then available for download.
The selected files can be deleted using the ⠇ button.
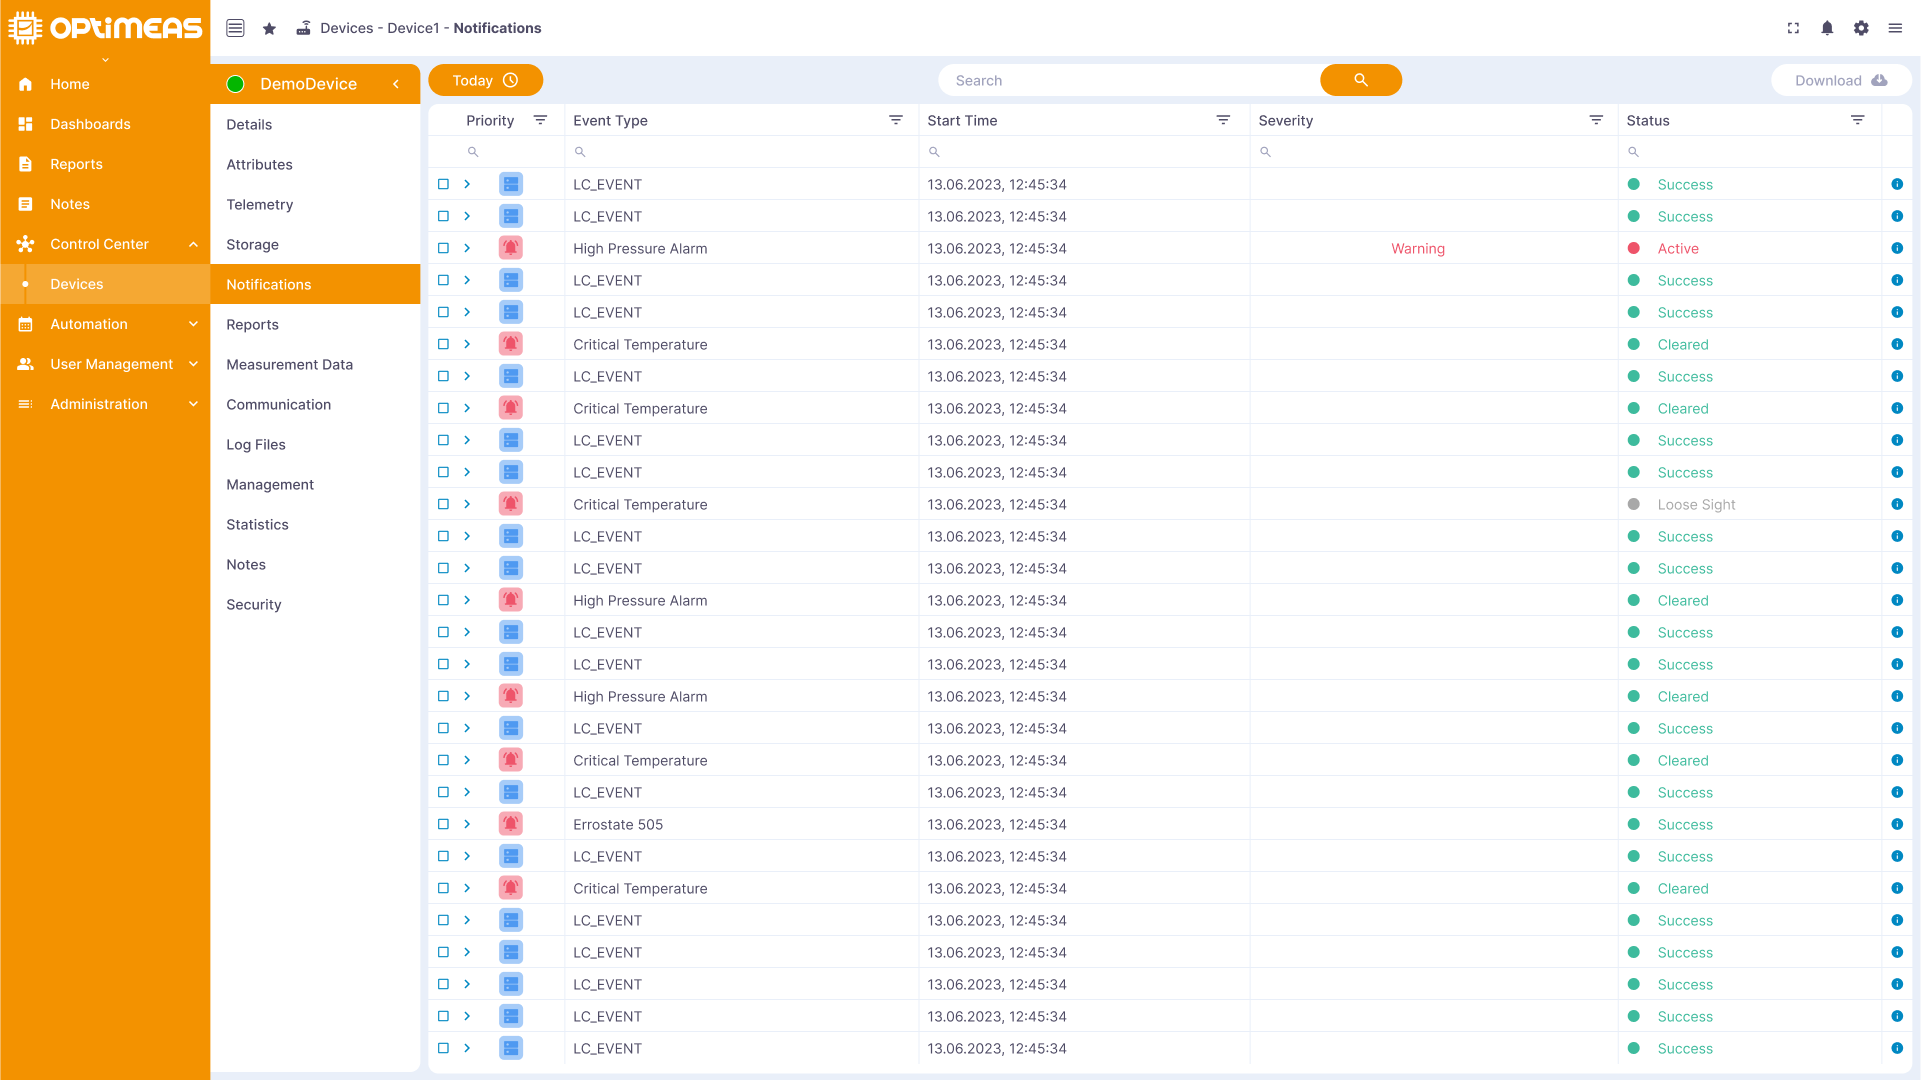
Notification
Alarms, events and other messages relating to the device are displayed here to inform users of important events.
In the button bar, a new file can be uploaded using the + button on the left-hand side.
Using the batch operations on the right-hand side, the selected files can be downloaded from the Explorer by clicking on the Download button, whereby these are packed in the background into a common .ZIP file, which is then available for download.
The selected files can be deleted using the ⠇ button.
The current notifications and information about them are displayed in the table. The table consists of the following columns:
| Name | Description |
|---|---|
| Type | Type of event Alarm / Connectivity Event |
| Event Type | Type of Event Connectivity Event - Deactivated/Activate : Alarm Error/Warning |
| Severity | Severity of the event |
| Start Time | Time at which the event occurred |
| Status | Status of the event Active/Cleared/Lose Sight/Success |
The table header can be used to sort, search and filter as usual.
The ⠇ button on the right-hand side of the table can be used to display the raw data of the notification \
Reports
Generated reports on the history and performance of the device are saved in this section to provide insights into past events.
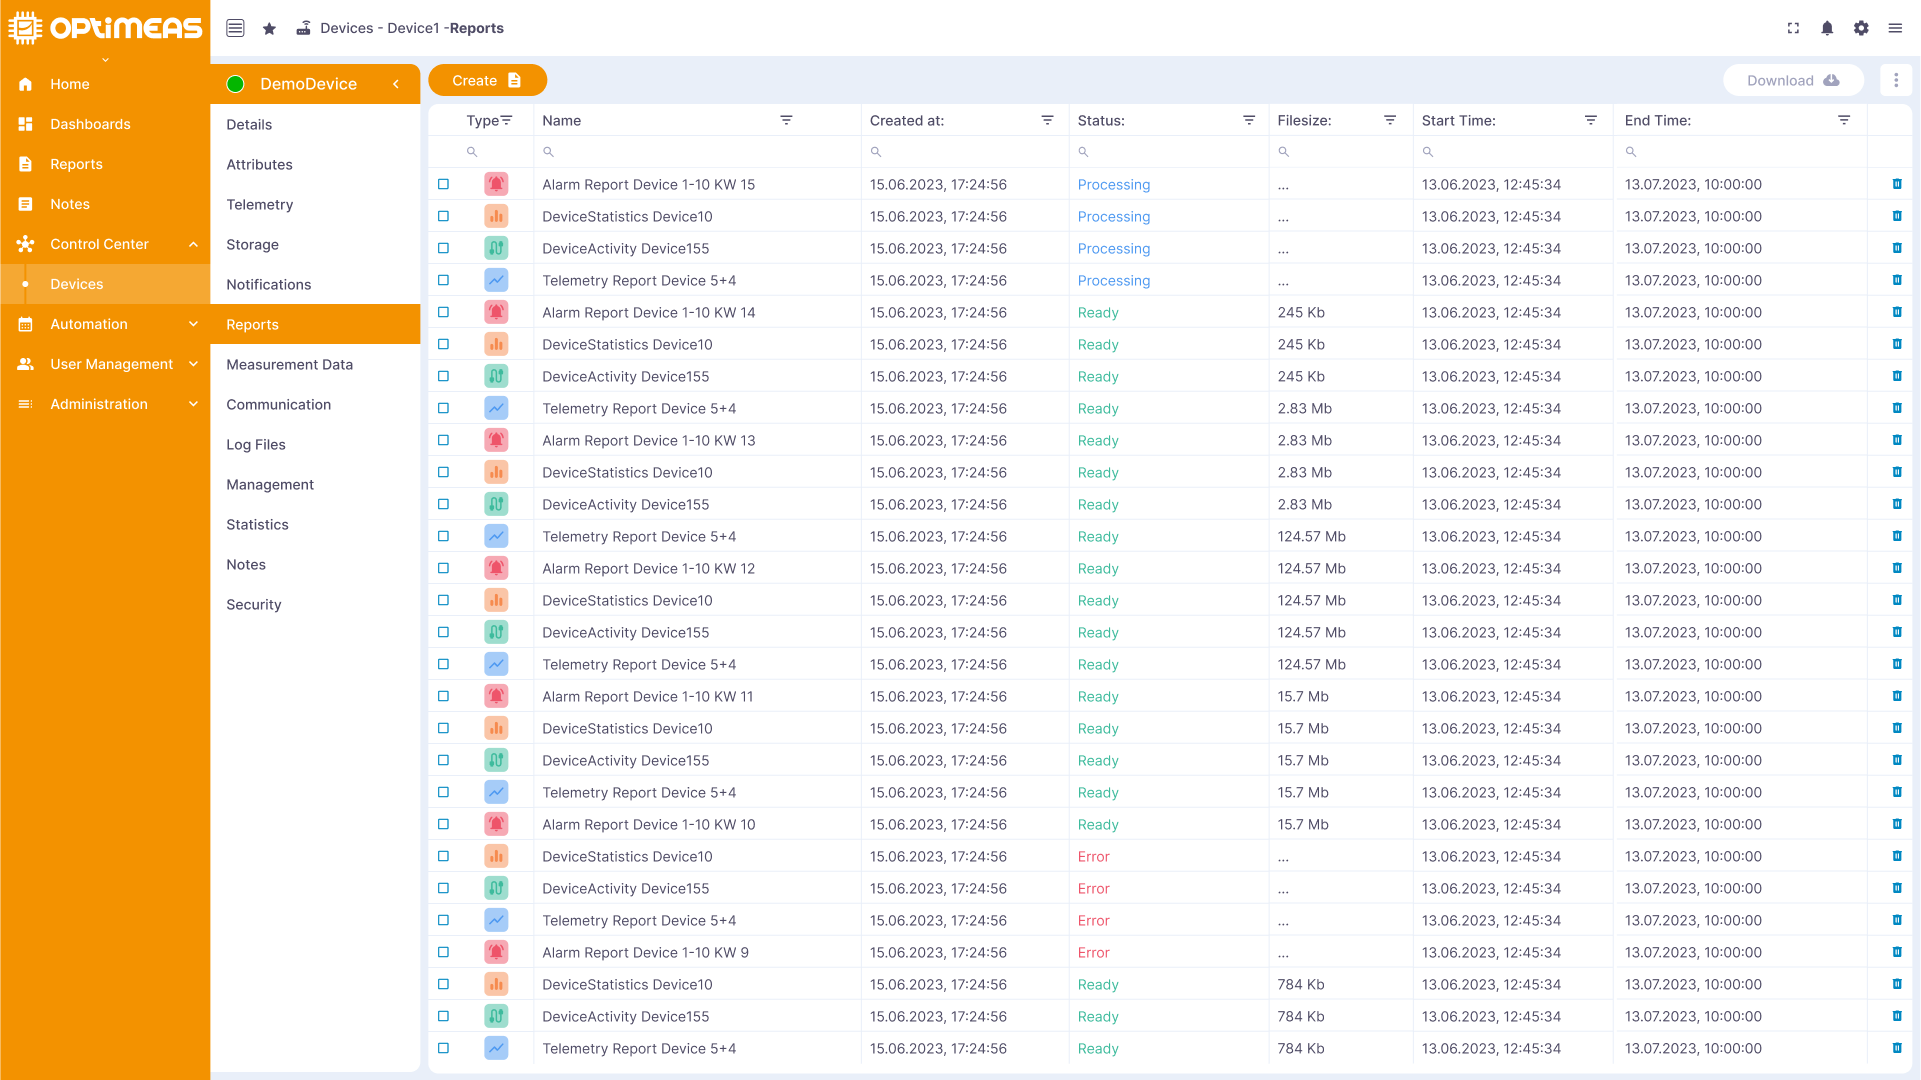
The reports already created for this device are listed in the table. The table consists of the following columns:
| Name | Description |
|---|---|
| Type | Type of report Statistics/Connectivity/Alarm/Telemetry/OSF |
| name | file name of the report |
| Creation time | Time at which the report itself was created |
| Status | Status of the report Success/Failure/Processing |
| File size | File size of the downloadable report |
| Start time | Start time of the time range covered by the report |
| End time | End time of the time range over which the report extends |
The table header can be used to sort, search and filter as usual.
The report can be deleted using the delete button on the right-hand side of the table
The report can be downloaded using the Export button
Measurement data
High-resolution measurement data from the device is archived here and can be used for detailed analyses.
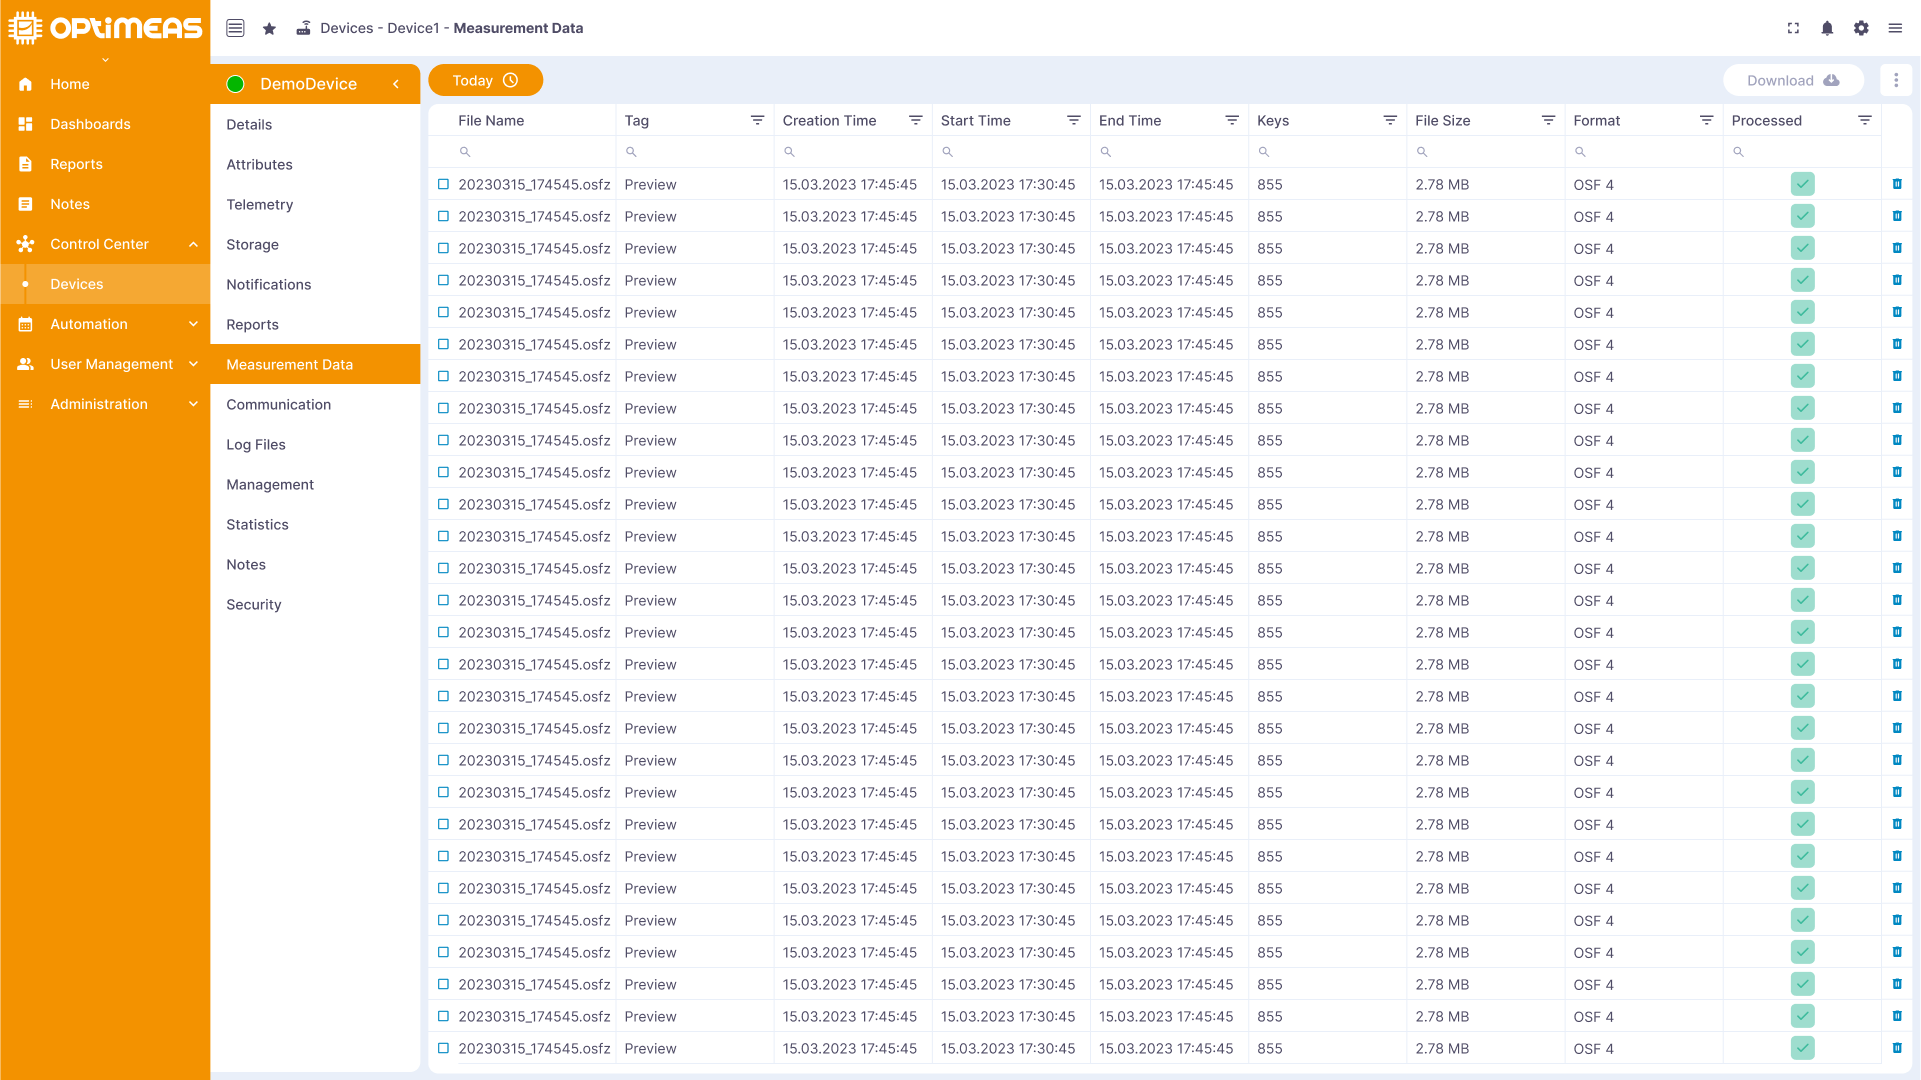
The reports already created for this device are listed in the table. The table consists of the following columns:
| Name | Description |
|---|---|
| filename | name of the OSF file |
| Tag | Tag with which the OSF file was created |
| Creation time | Time at which the file was created |
| Start time | Start time of the measurement contained in the file |
| End time | End time of the measurement in the file |
| Channels | Number of measurement channels contained in the file |
| File size | Size of the file |
| Format | Format of the measurement data file |
| Aggregated | Aggregation status of the measurement data file |
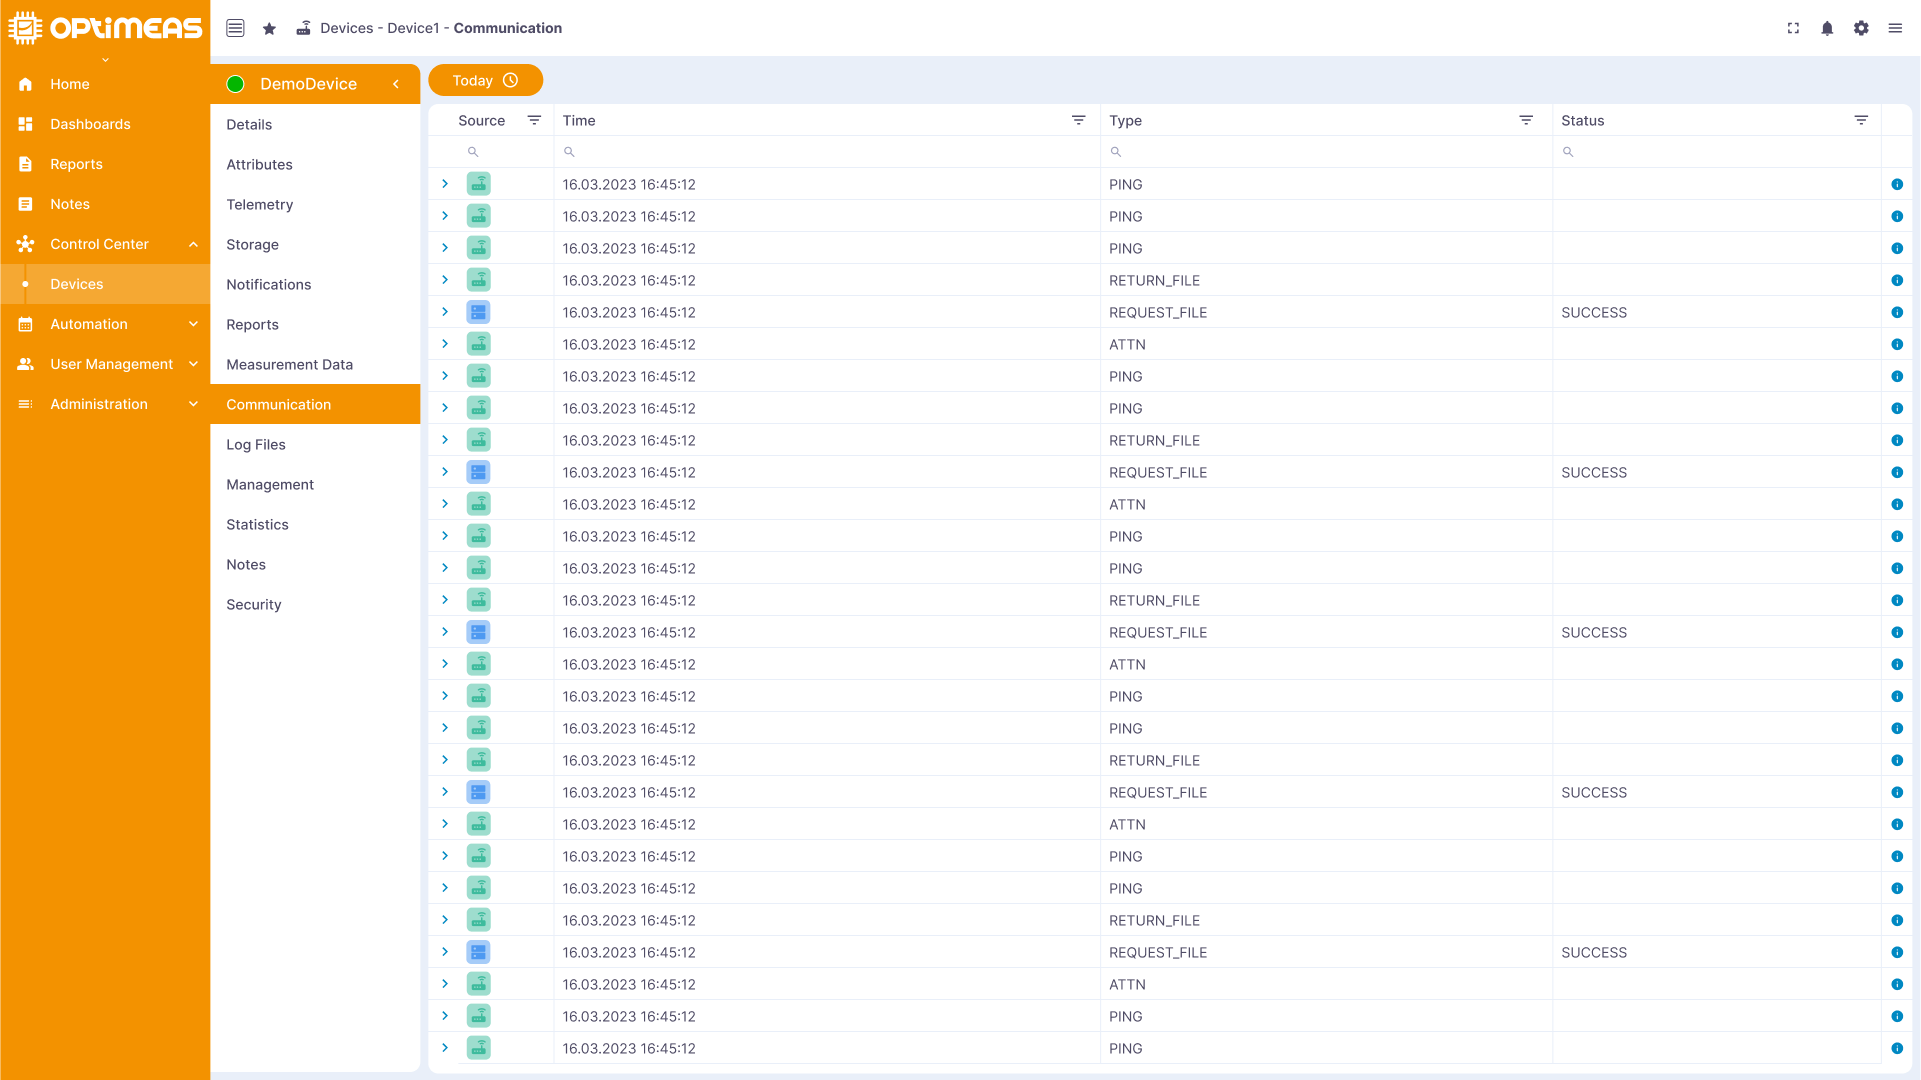
Communication
This section provides an overview of the communication that takes place between the device and the cloud, including protocols and data transfers.
| Name | Description |
|---|---|
| Update time | Time of the last update to the original message |
| Type | Type of message |
| Status | Status of the message |
Logfiles
Log files containing information about the operation of the device and any problems are saved for error analysis.
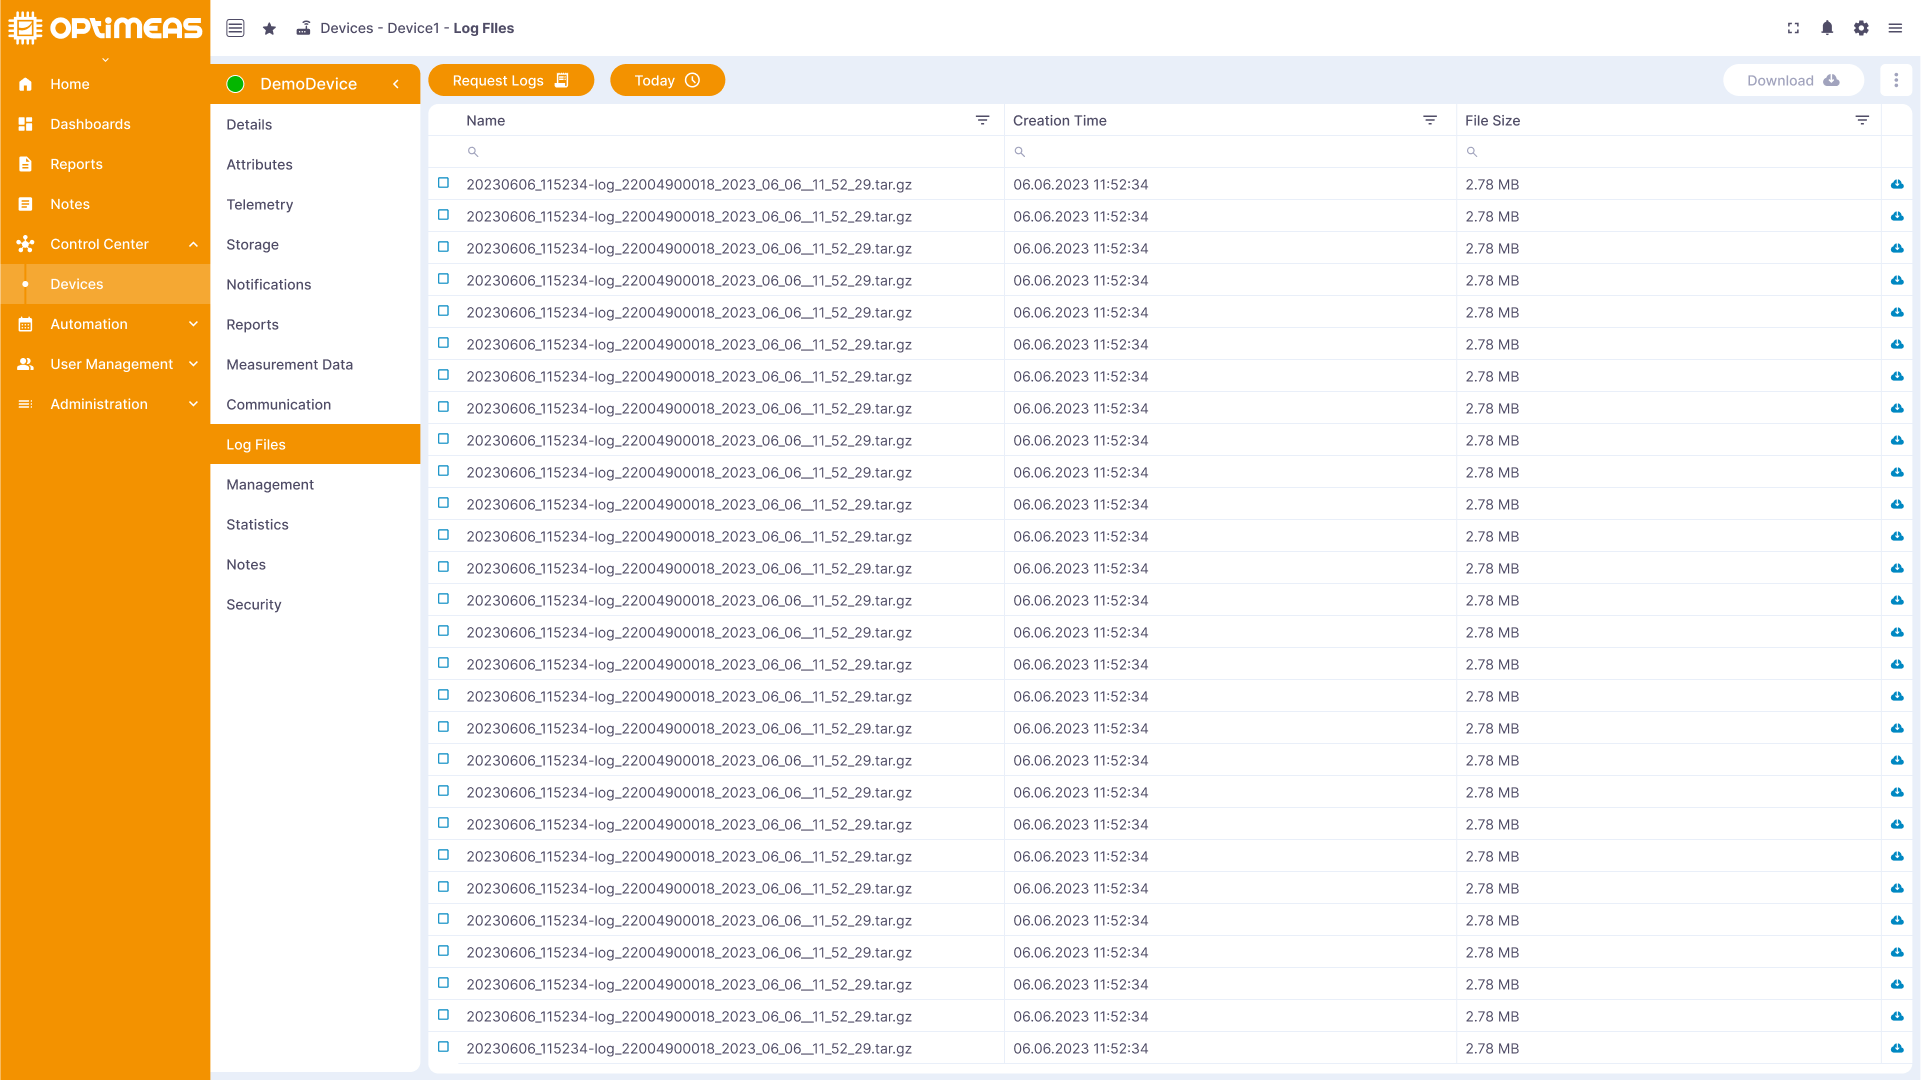
| Name | Description |
|---|---|
| Name | Name of the log file |
| Creation time | Creation time of the log file |
| File size | File size of the log file |
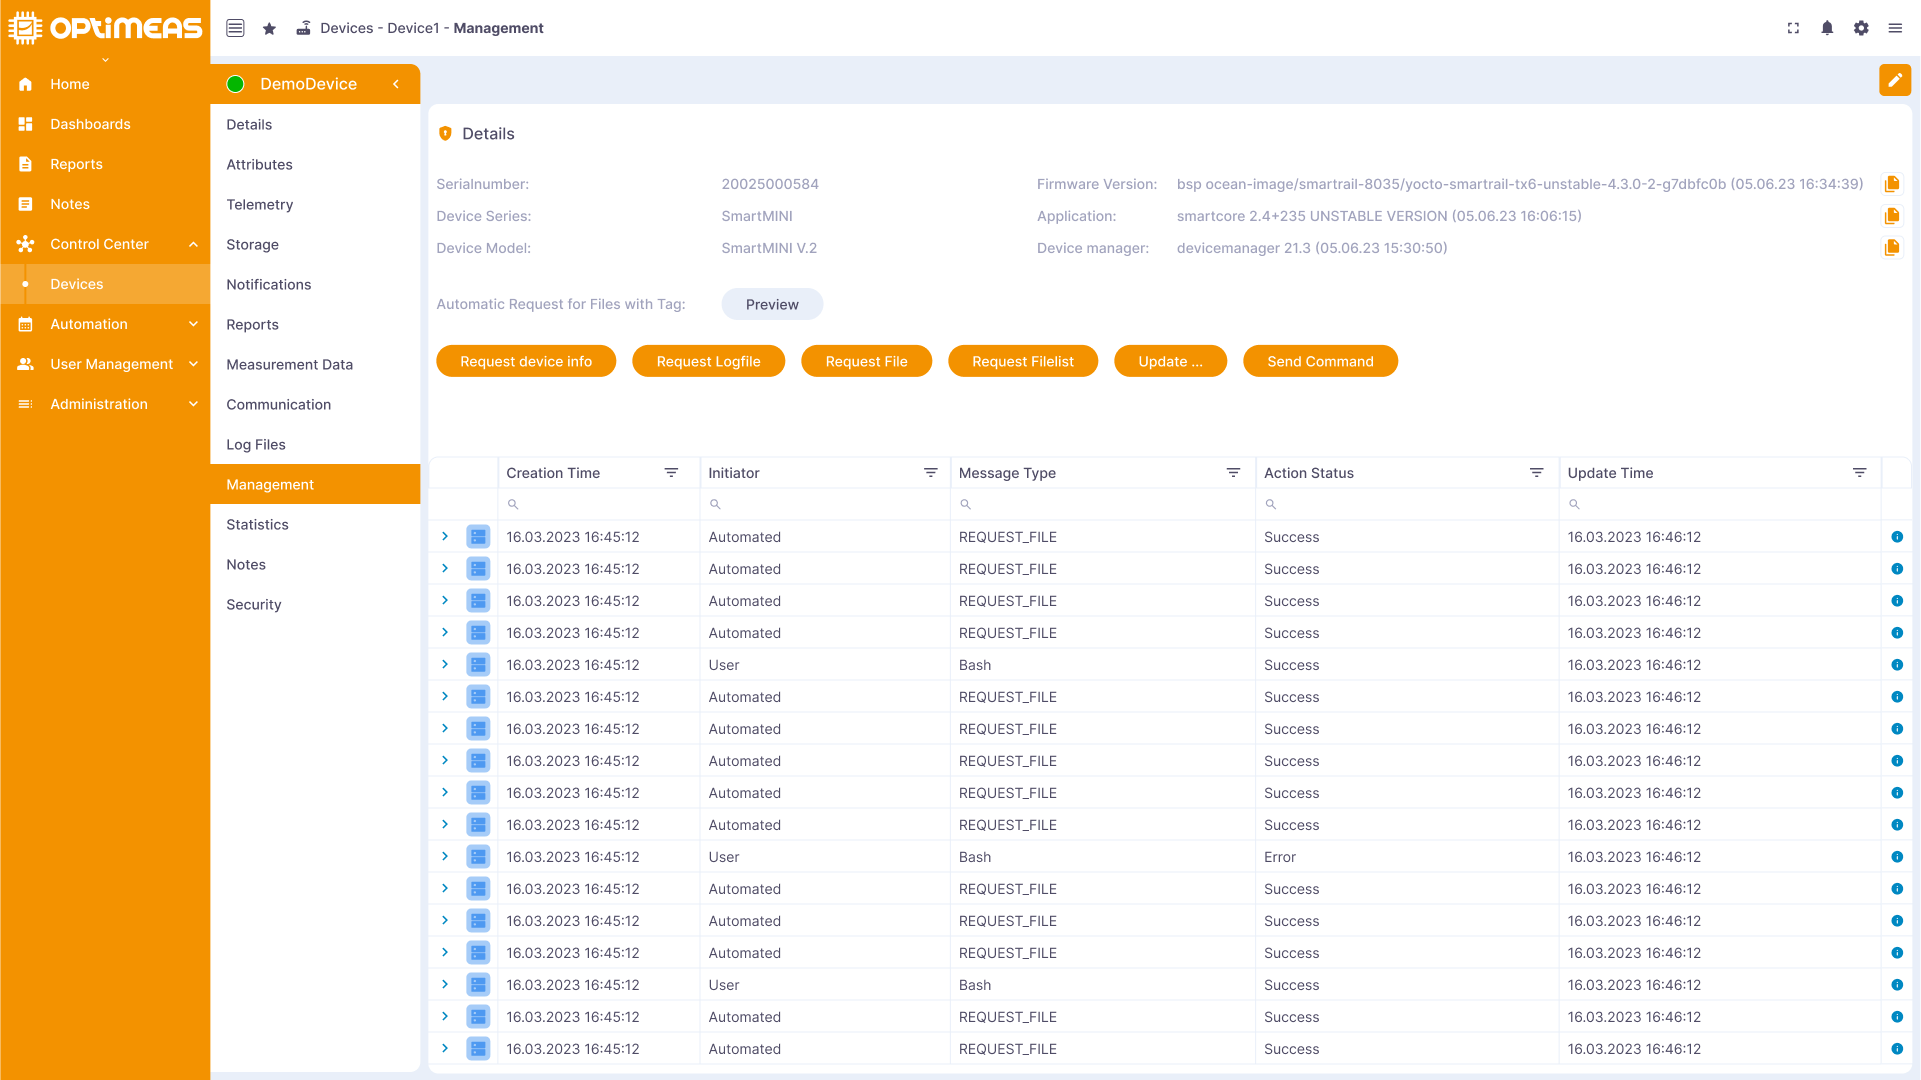
Management
Here, users can utilize the additional management functions within the device management of OptiMEAS devices to update the device, change configurations and perform other management tasks.
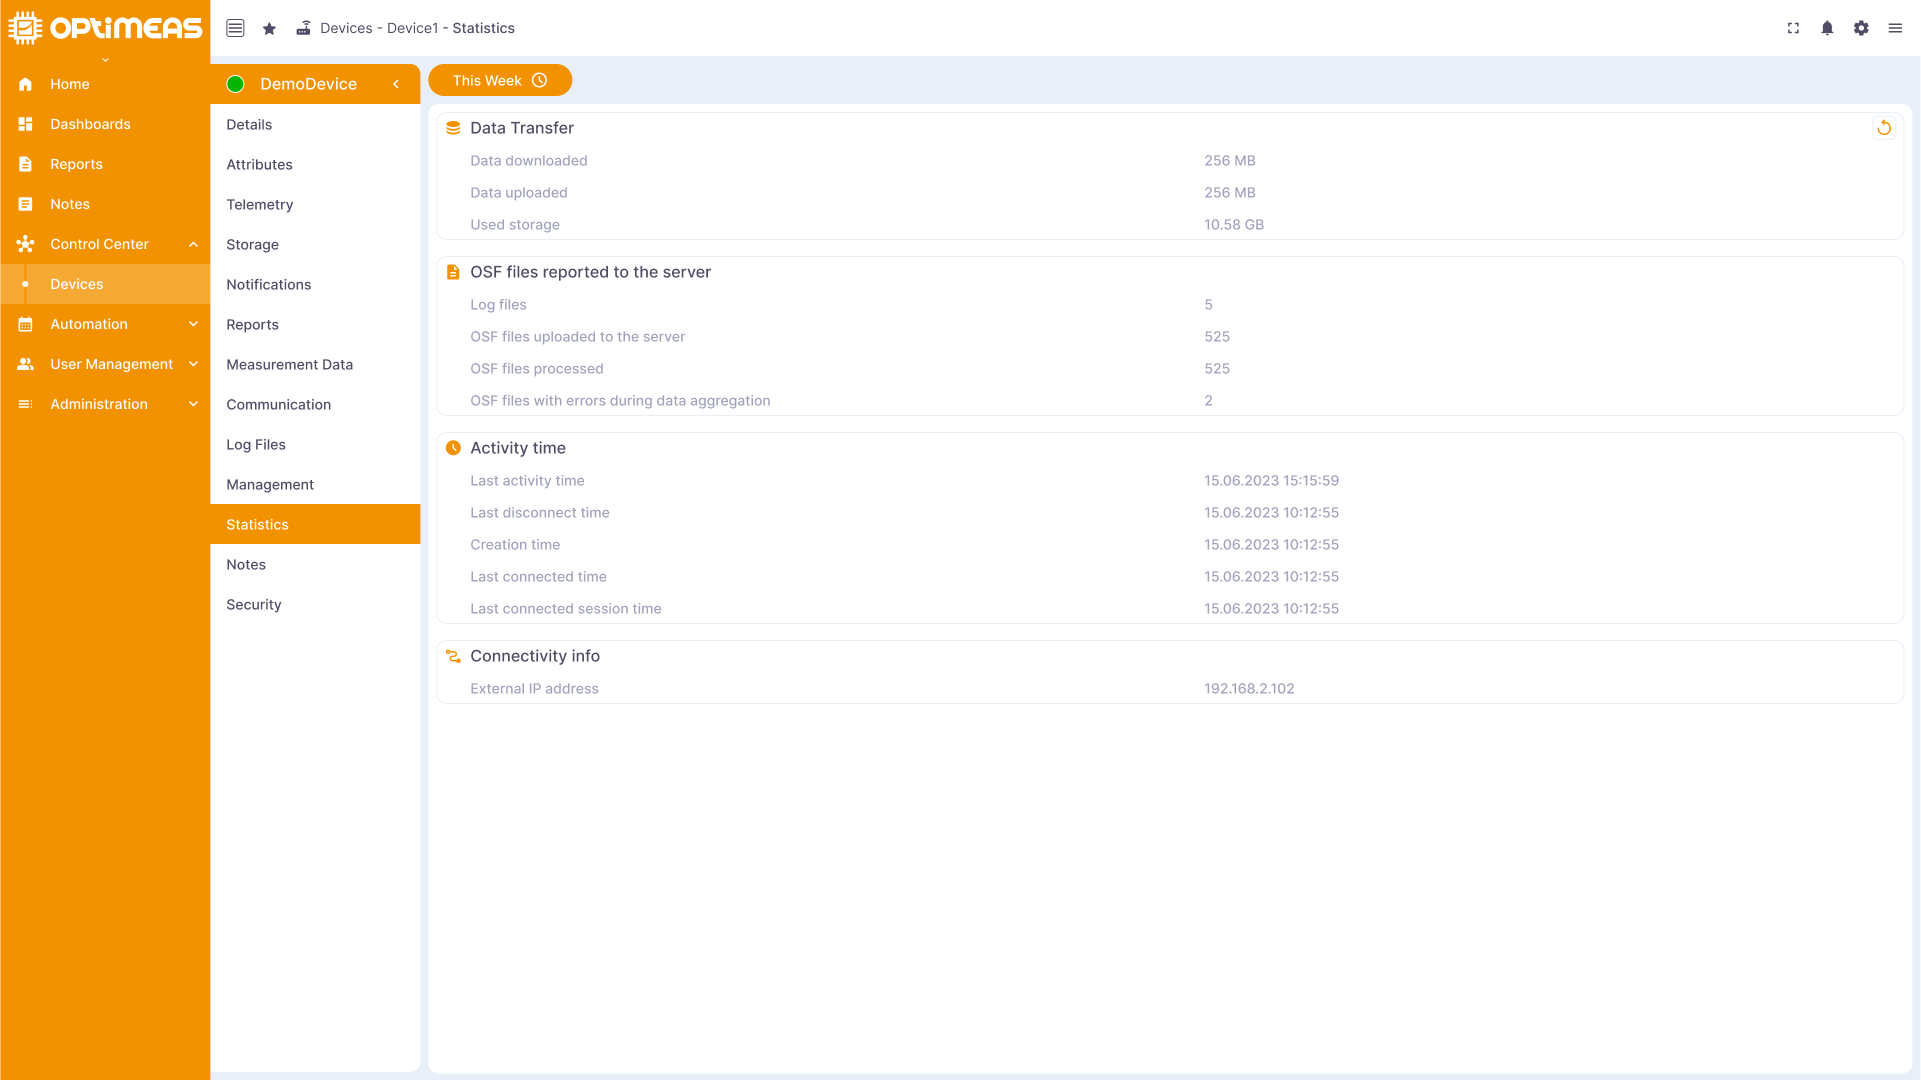
Statistics
Statistical information about the device, such as connection statistics and memory utilization, is provided here to monitor performance and identify bottlenecks.
| Name | Description |
|---|---|
| Creation time | Creation time of the message |
| Initiator | Initiator of the message Device / User |
| Message type | Type of message |
| Status | Status of the message |
| Updated Time | Last update time of the message |
Notes
Users can add notes to a device to document relevant information or make comments.
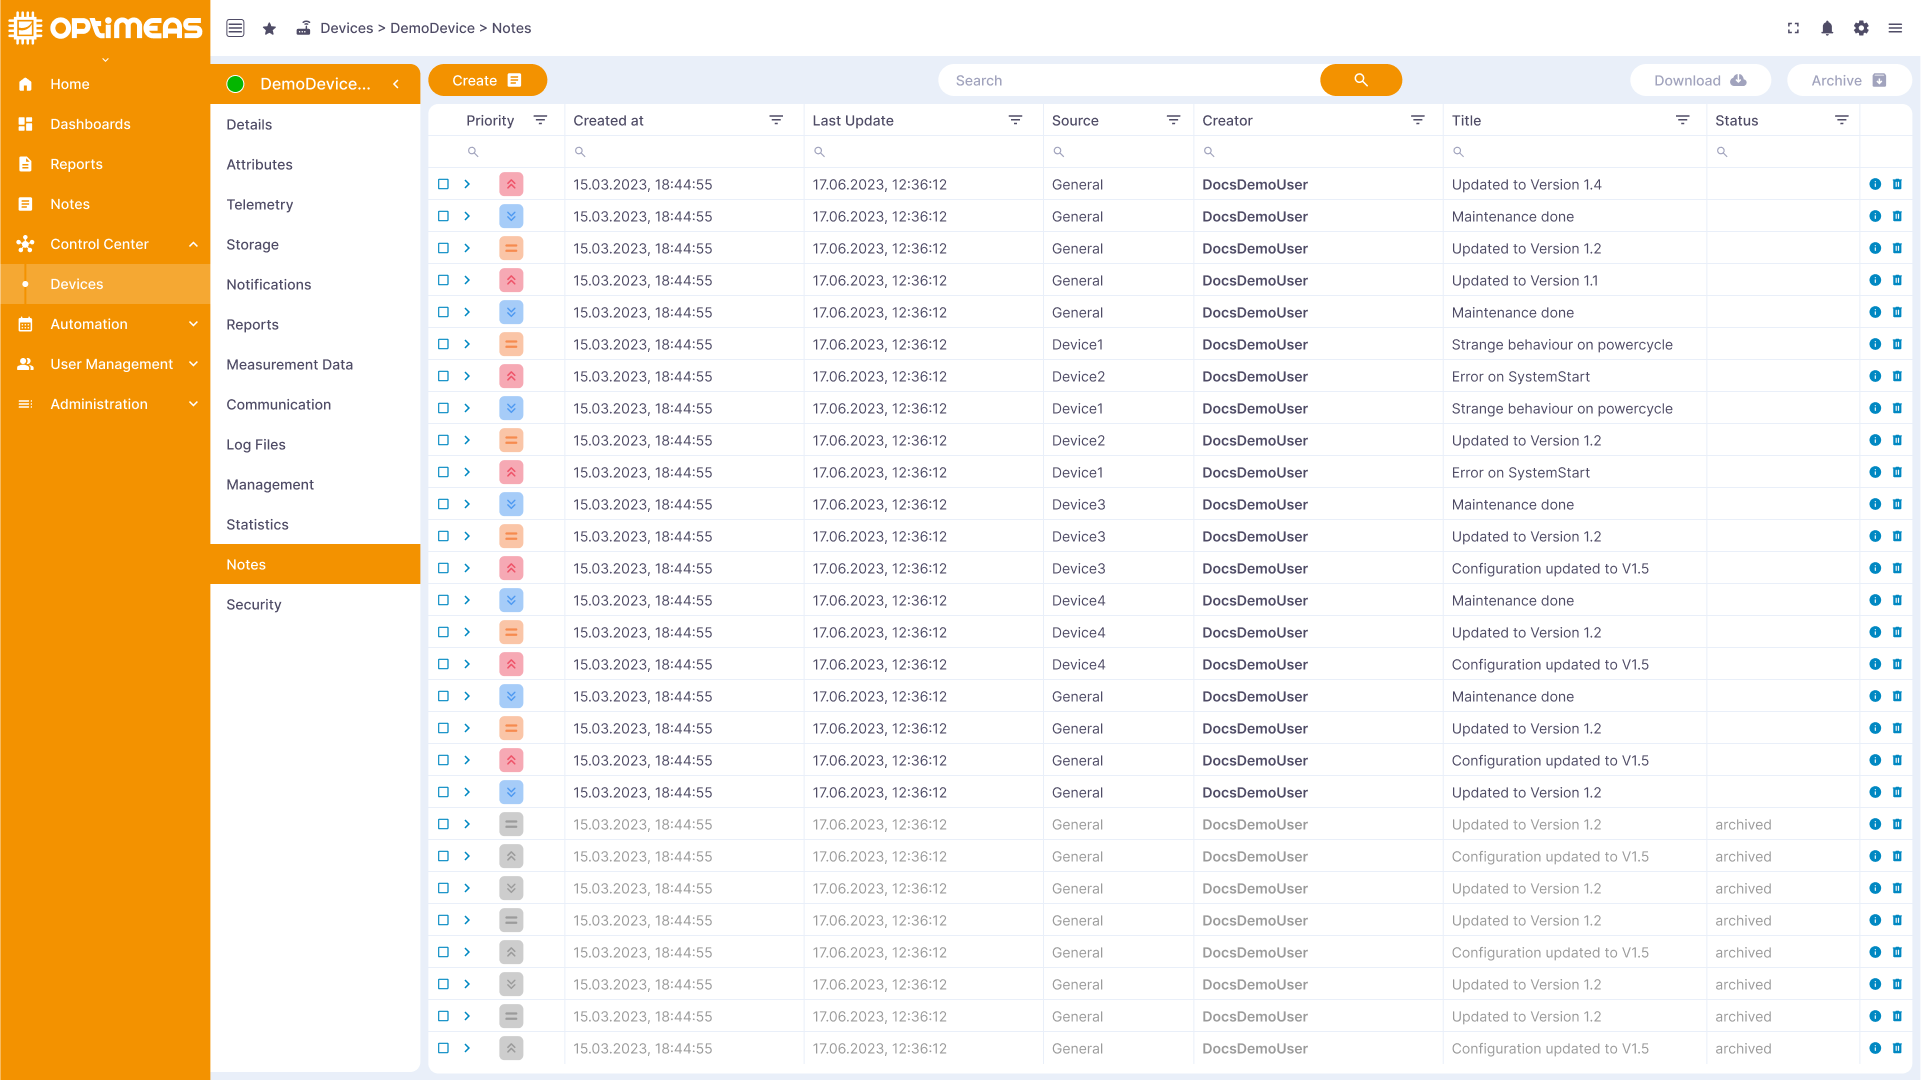
| Name | Description |
|---|---|
| Status | Status of the note Active / Archived |
| Priority | Priority of the note Low / Medium /High |
| Creation time | Creation time of the note |
| User | Email address of the user who created the note |
| Title | Title of the note |
| Updated | Time the note was last updated |
Security
Device security information such as IDs, tokens and other security features are managed here to ensure the integrity and protection of the device.
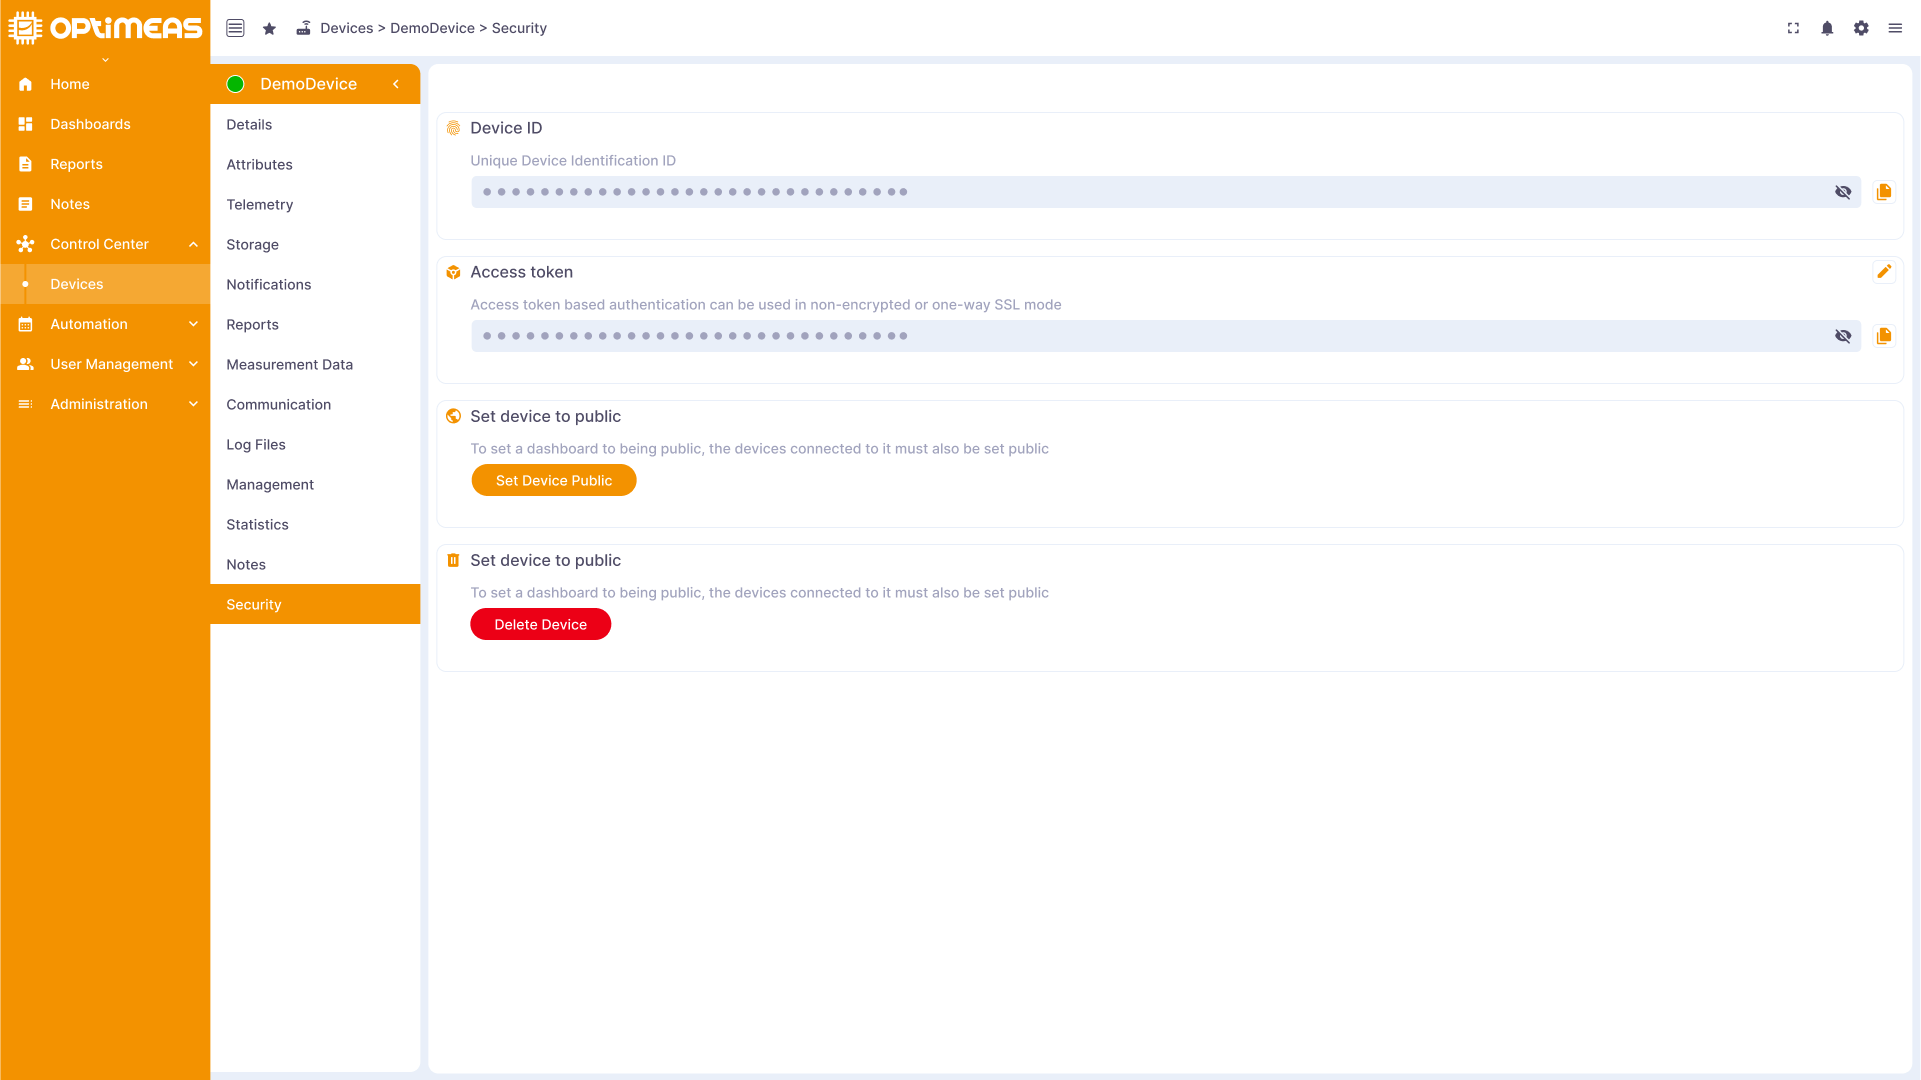
| Name | Description |
|---|---|